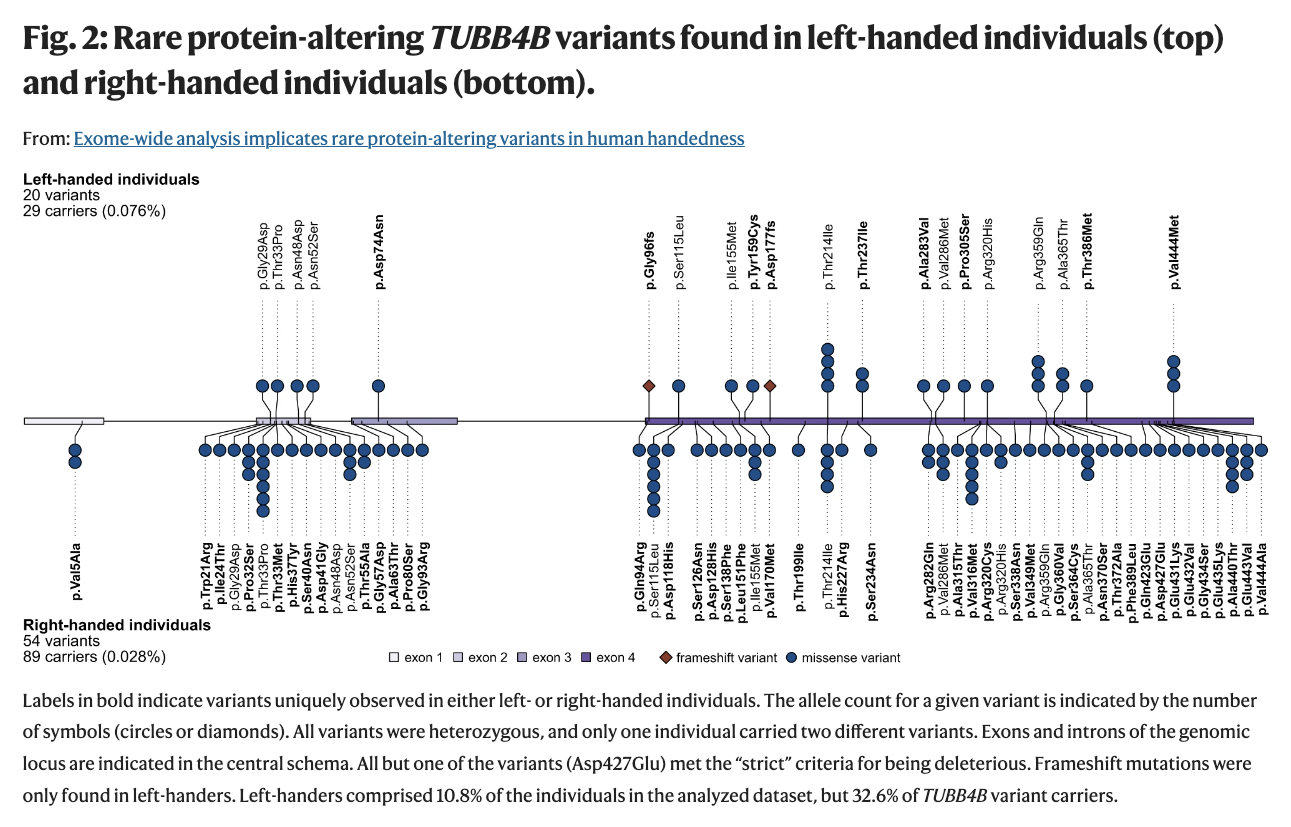
Are you a lefty? Well, I am. And so was my mom. And her father. AND our daughter. So I was curious to learn how rare genetic factors may contribute to the roughly 10% of us who are left-handed. As reported in GenomeWeb, researchers at the Max Planck Institute for Psycholinguistics in the Netherlands and Radboud University used exome data from the UK Biobank to search for clues. What they found is that variations in the beta-tubulin gene TUBB4B occurred at a rate 2.7 times higher in left-handers than right-handers.
TL;DR I did not find these rare variants, but it never hurts to look.
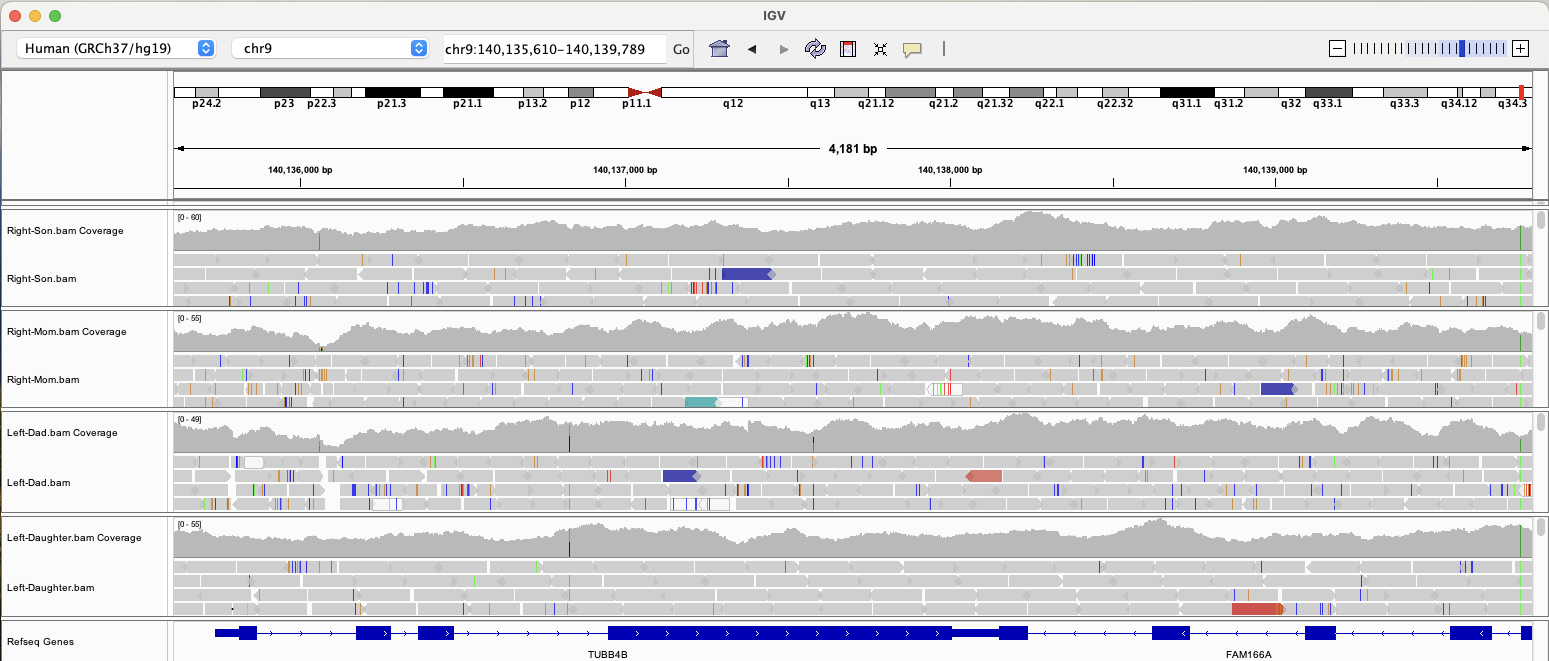
Naturally, I wanted to see if our daughter and I shared any of these mutations, so I fired up IGV to visualize our WGS data and take a look at TUBB4B. (Click the image to make it larger.)
It turns out that we do not have any of the rare mutations mentioned in the paper, but then again, these particular variations explain only 0.91% of expected heritability. (Left-handedness shows heritability of ~25% in twin-based analysis.)
After creating FASTQ files from my BAM data and learning how to use Terra, I was finally ready to run the Whole Genome Analysis Pipeline. This collection of workflows, called a “workspace,” contains the latest GATK Best Practices workflows for whole genome sequence (WGS) data, including pre-processing, germline short variant discovery, and joint variant calling. Although I am working with a single human genome (my own), this same production pipeline is routinely used on thousands of WGS samples every day.
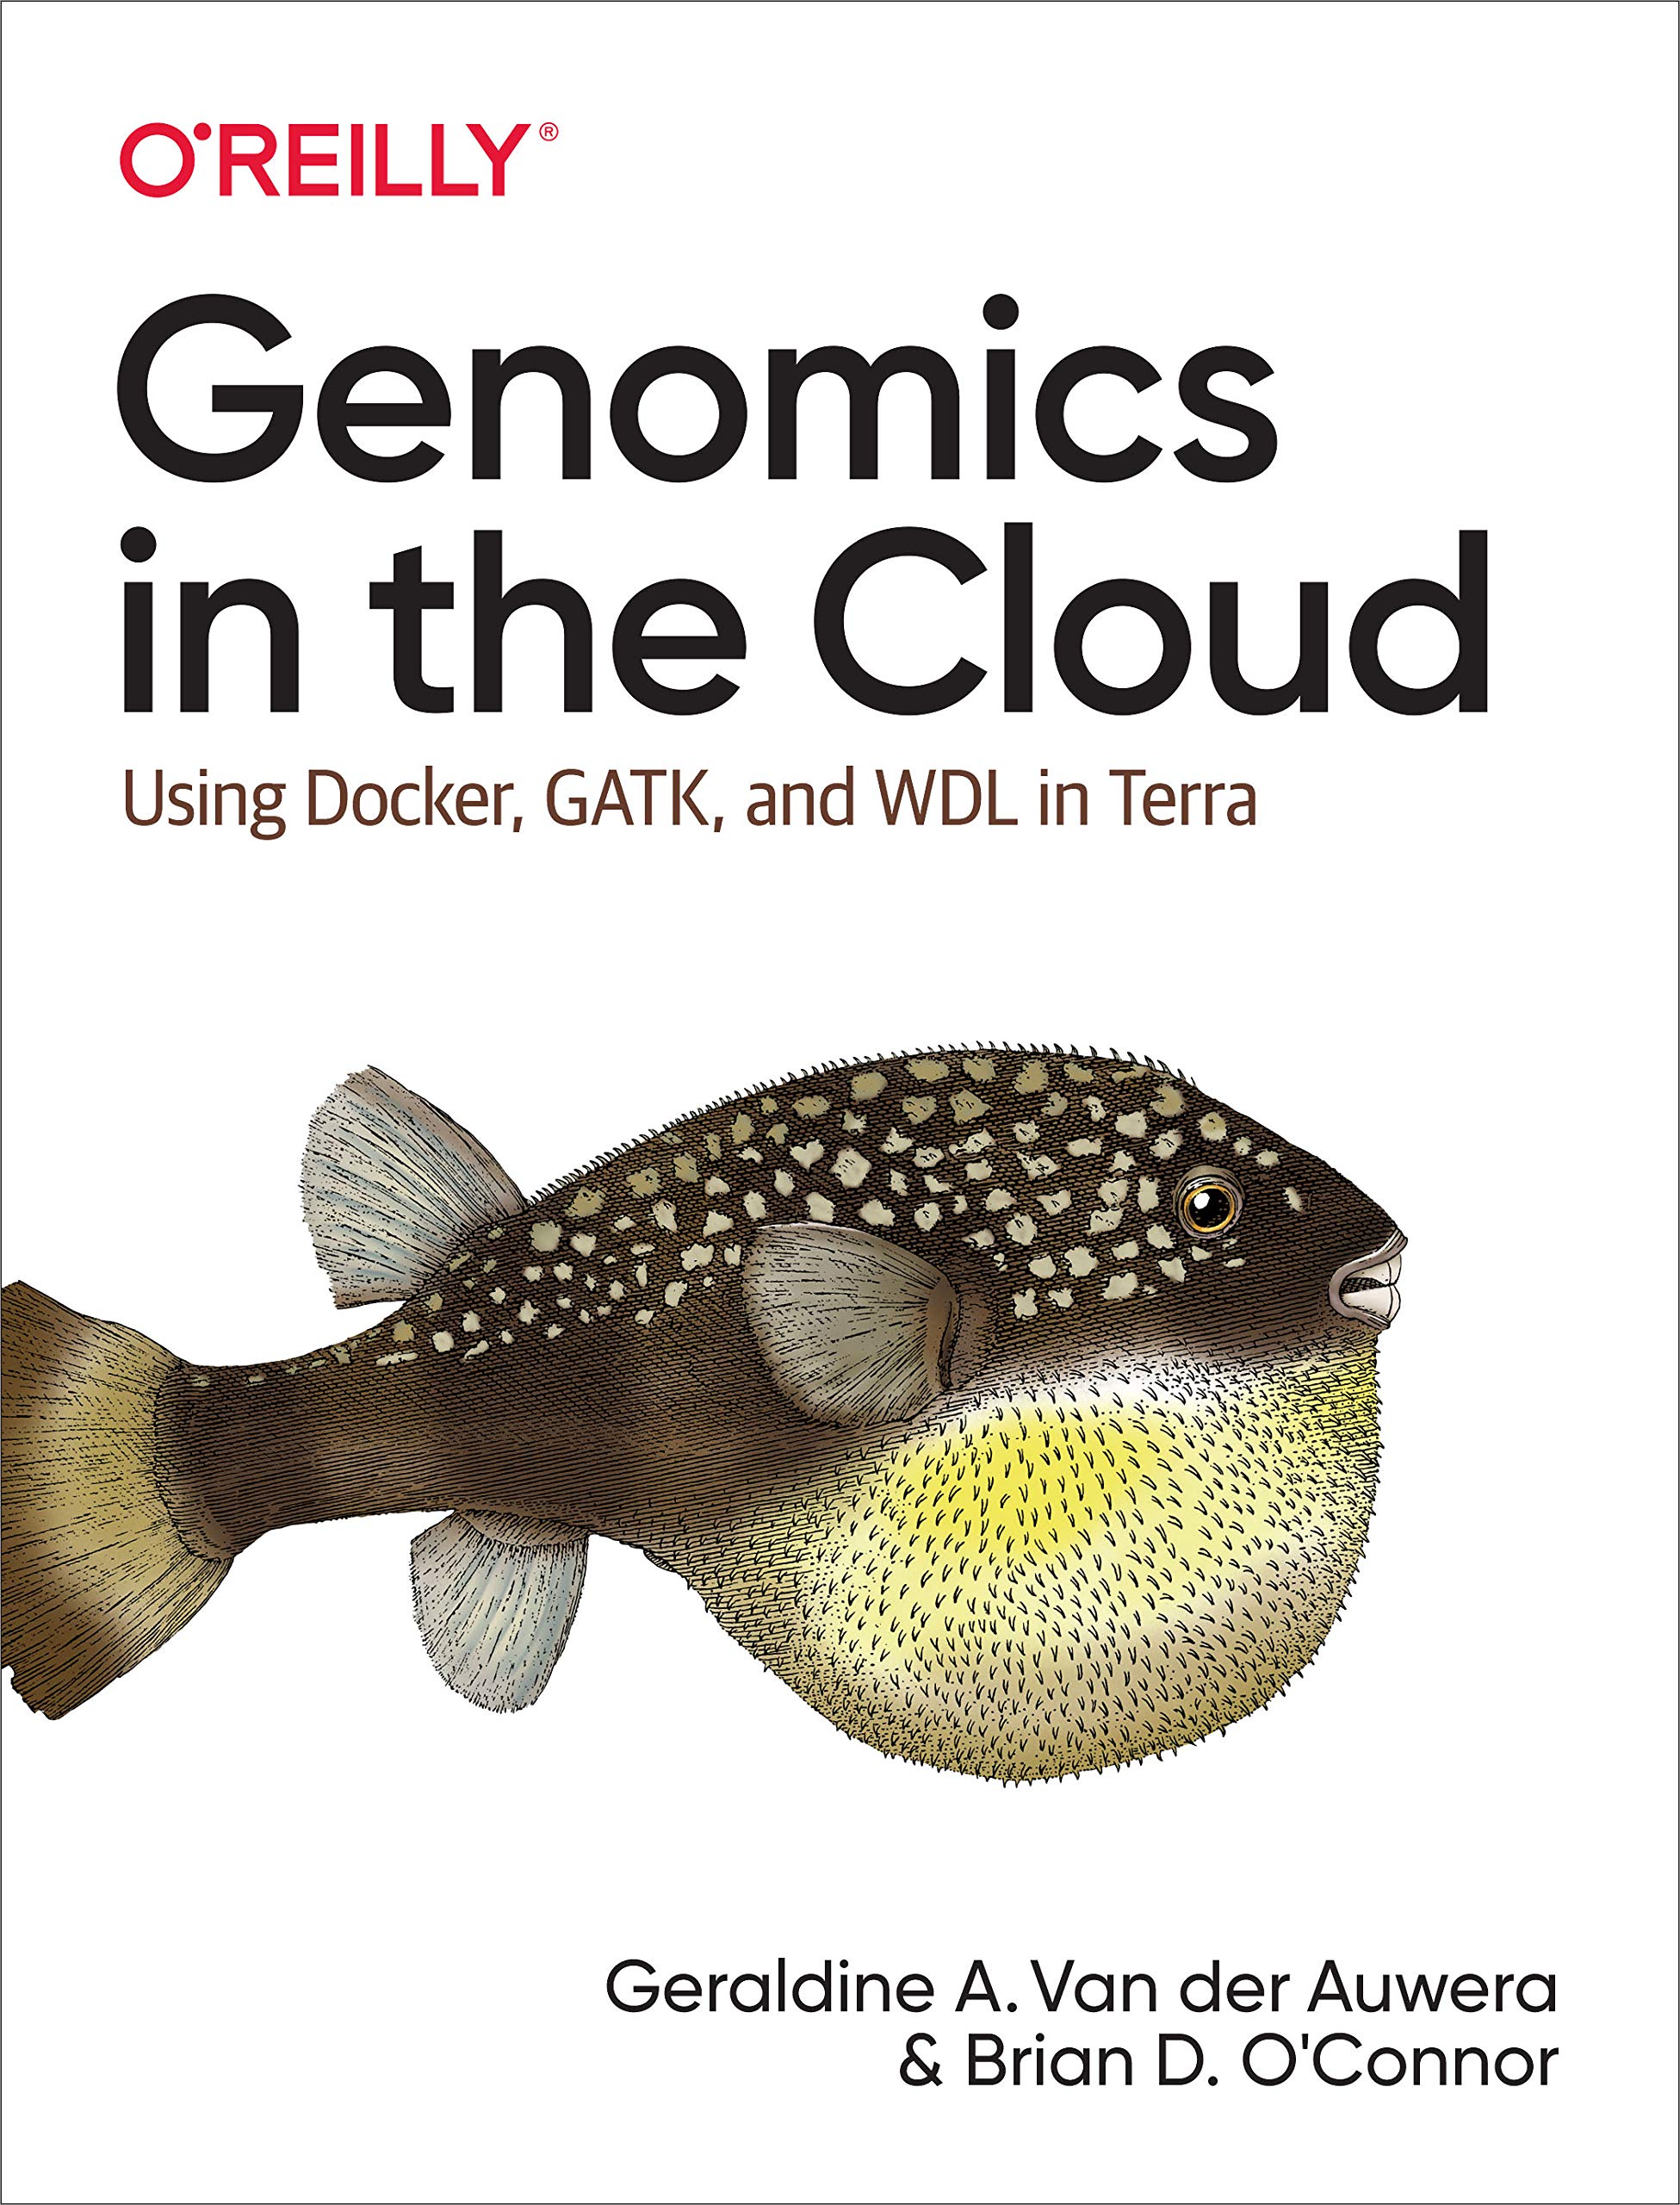
Being a relative newcomer to GATK and a complete notice with Terra, the path to success was a little bumpy. Before jumping into what I learned, I want to acknowledge the staff at the Broad, who were extraordinarily kind. Starting with with GATK’s Benevolent Dictator for Life, Geraldine Van der Auwera, who is coincidentally the co-author of a highly informative book, Genomics in the Cloud. This blog post would not be possible without the knowledge that I gleaned from those pages. The Terra support team has also been wonderfully responsive–I even received a call from a designer at the Broad asking how they could improve Terra’s user experience!
Below, I describe the reprocessing of my WGS data. The goal is to have a consistent baseline as we continue to search for answers in our genes.
Note: Terra is evolving rapidly, and you may find that some links have changed. These tips were current as of this writing (June 2021). Drop me a line on Twitter if you see an improvement that I can add.
1. Creating unmapped BAM (uBAM) files from paired end files
Our family’s WGS data was processed on Illumina sequencers, albeit on different machines at different times. To get started, the first processing step is to create unmapped BAM (uBAM) files from raw FASTQ data. GATK’s use of uBAM files is an acknowledged “off label” use of the BAM file format, but it provides an opportunity to insert details (metadata) that would otherwise be absent. Given Illumina’s 75% market share, chances are high that you will be creating uBAM files using the “Paired FASTQ to unmapped BAM” workflow located in the Sequence-Format-Conversion workspace (or something similar).
2. Read Groups (@RG) in the uBAM file
After creating uBAM files, my first run of the 1-WholeGenomeGermlineSingleSample workflow ended with an error (after three days of processing):
Task UnmappedBamToAlignedBam.CheckContamination:NA:1 failed. Job exit code 255. Check gs://my-terra-bucket/.../call-CheckContamination/stderr for more information. PAPI error code 9. Please check the log file for more details: gs://my-terra-bucket/.../call-CheckContamination/CheckContamination.log.
To start debugging the CheckContamination subtask, I fired up the cloud-based Jupyter notebook within Terra (very cool), attempted to copy the sorted BAM file to the notebook environment, and promptly ran out of disk space. To create enough disk space for your BAM file, go to settings (look for the big gear in upper right corner) and change the persistent disk size to 100 GB.
The cause of this error turned out to be a misunderstanding about read groups. In the BAM file, you can see two different values in the read group (@RG) field: Pickard-K-Thomas_C and Pickard-K-Thomas_A. Those values have to be the same; otherwise, CheckContamination thinks your BAM file has been “contaminated” with multiple samples.
The fix was to go back to Sequence-Format-Conversion and change three values in WORKFLOWS>INPUTS, which in turn inserts the correct metadata in your uBAM files–many thanks to Geraldine for pointing this out:
Change readgroup_name from this.read_group to this.read_group_id
Change sample_name from this.sample_id to this.sample
Change additional_disk_space_gb to 100
Other notes:
This article was invaluable to understand how read groups (@RG) work.
ID (Read Group IDentifier) field: Each ID value must be unique.
SM (SaMple) field: Unlike ID, the sample name must be the same in all SM fields.
LB (LiBrary) field: I referenced my unique Illumina ID for DNA prep library traceability.
PL (PLatform) = ILLUMINA (all caps)…I read an official list of sequencers in the documentation and “ILLUMINA” is on that list.
PU (Platform Unit) field: The convention is to use periods as the delimiter in the lane identifier, not underbars as used in the FASTQ filename.
CN (Sequencing CeNter) field: I used “Illumina” because they processed this sample.
DT (DaTe) field: Using the ISO 8610 combined date/time standard worked for me. Interestingly, Terra converted my local time to UTC time inside the BAM file (which makes sense given that genomes can be processed across multiple timezones).
From the Sequence-Format-Conversion workflow, here’s my successful DATA>TABLE>read_group page in tsv format:
Creating uBAM files took about four hours at a cost of $1.15. It was time for a second run of the 1-WholeGenomeGermlineSingleSample workflow.
3. CheckFingerprint issue #1
This time, the sticking point was at the end of the pipeline in a routine called CheckFingerprint, which is called as a subtask within AggregatedBamQC. Here’s the error (also found after three days of processing):
Job AggregatedBamQC.CheckFingerprint:NA:1 exited with return code 1 which has not been declared as a valid return code. See 'continueOnReturnCode' runtime attribute for more details.
I checked the CheckFingerprint.log and suspected the issue was related to the NA12878 dataset (what was that doing there???):
WARNING 2021-05-11 21:25:40 FingerprintChecker Couldn't find index for file /cromwell_root/dsde-data-na12878-public/NA12878.hg38.reference.fingerprint.vcf going to read through it all.
WARNING 2021-05-11 21:25:40 FingerprintChecker There was a genotyping error in File: file:///cromwell_root/dsde-data-na12878-public/NA12878.hg38.reference.fingerprint.vcf
Cannot find sample 1-WholeGenomeGermlineSingleSample_2021-05-09T05-11-16 in provided file.
The fix for CheckFingerprint issue #1
After some head scratching, I found the solution by scrolling to the bottom of WORKFLOWS>INPUTS. There, I found a field called fingerprint_genotypes_file, which had a value of: gs://dsde-data-na12878-public/NA12878.hg38.reference.fingerprint.vcf
Note: When debugging your problem, keep in mind that searching the Terra knowledge base does not include results from GATK documentation, which can be very useful for GATK- or Picard-related issues.
4. CheckFingerprint issue #2
The third run was also unsuccessful–this time the issue was a little trickier. Here’s the error message (also found after three days of processing!):
INFO 2021-05-11 21:27:00 CheckFingerprint Read Group: null / Pickard-K-Thomas vs. 1-WholeGenomeGermlineSingleSample_2021-05-09T05-11-16: LOD = 0.0
ERROR 2021-05-11 21:27:00 CheckFingerprint No non-zero results found. This is likely an error. Probable cause: EXPECTED_SAMPLE (if provided) or the sample name from INPUT (if EXPECTED_SAMPLE isn't provided) isn't a sample in GENOTYPES file.
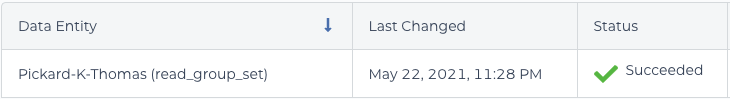
The fix for CheckFingerprint issue #2
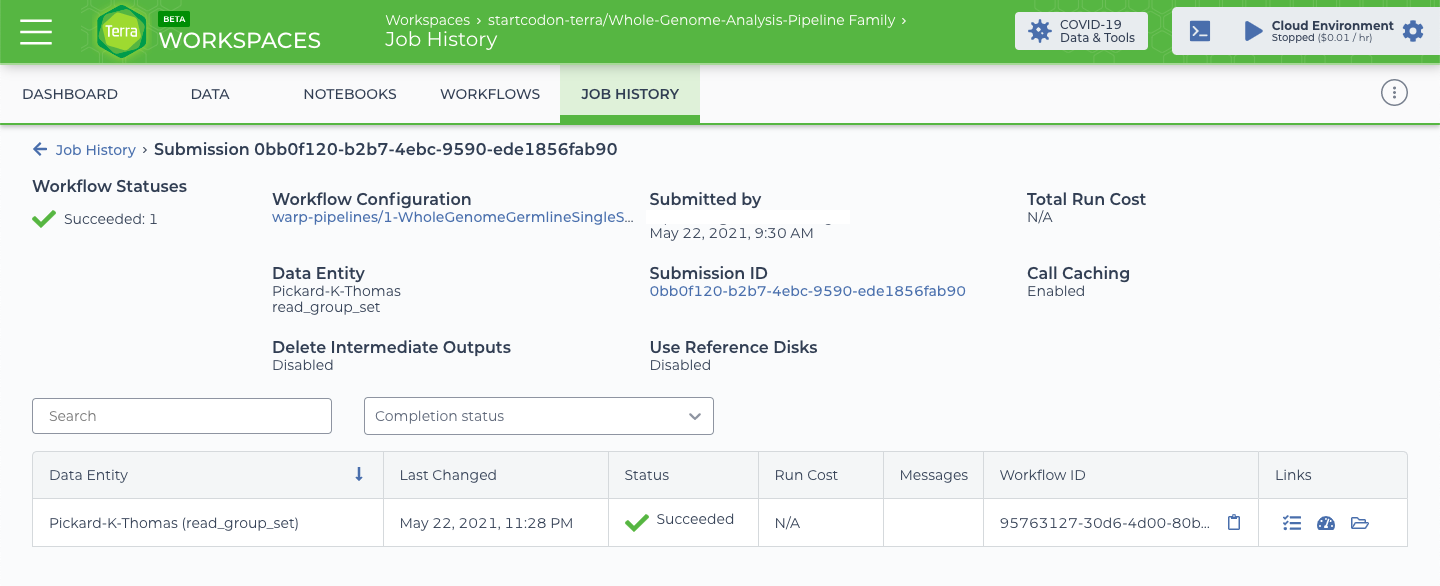
It turns out that the saved name of your WORKFLOWS>root entity>read_group_setmust match the name of your VCF output (in my case, Pickard-K-Thomas). In the error message above, the default read_group_set name (1-WholeGenomeGermlineSingleSample_2021-05-09T05-11-16) does not match, but is stored as the value in read_group_set_id in DATA>read_group_set . Saving the read_group_set name as “Pickard-K-Thomas” fixed the issue. The alternative is to change the value of WORKFLOWS>INPUTS>sample_and_unmapped_bams, which uses read_group_set_id by default. Yikes!
Note: Understanding the standard data model is critical to your success. This article, chapters 11 and 13 in Genomics in the Cloud, and these videos will assist in wrapping your head around it. I found the data model to be the most challenging part of this process.
I launched 1-WholeGenomeGermlineSingleSample for the fourth time, but aborted it after four days of processing (thinking that the software was broken).
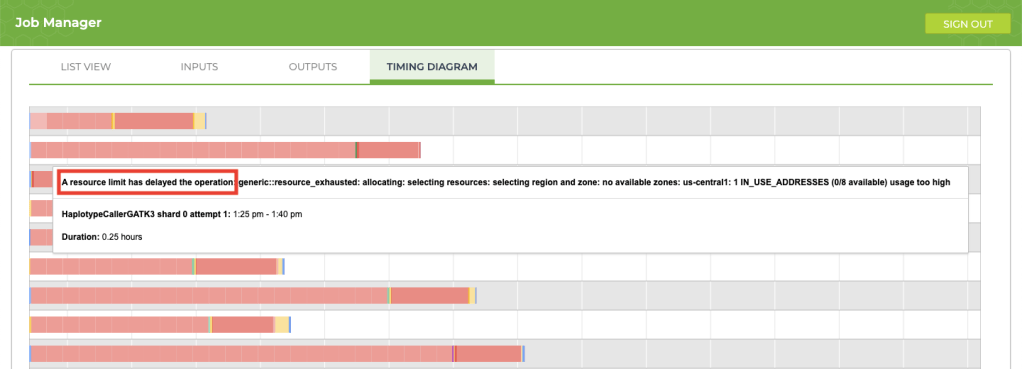
5. Improving process delays
If your job is taking longer than usual (say, an extra 12+ hours), take a look at the timing diagram in the Job Manager. If you see a bunch of pink boxes, it’s time to submit a request to Terra Support for more resources. To submit support requests, you must create a Zendesk account that is separate from your Terra account. The good news is that the support account that you create for Terra will also be valid for questions that you submit to the GATK Community Forum.
This article provides an excellent overview explaining how to request additional resources for your project. In my case, I wanted my jobs to run 30% faster, so I requested an increase for resources that were limited (IP addresses and CPUs). After forwarding my request, the support team took care of my request immediately and the issue completely disappeared. Here is the information that I provided for the request:
Your Terra billing project: YOUR-BILLING-PROJECT-GOES-HERE
Which quota(s) you want to increase: IP addresses and CPUs
What you want your new quota(s) to be: 30% higher than what they are now
Which regions you want the increase applied to, if applicable: us-central1
Rationale for increase: Research purposes
6. Information to include when submitting a support request
If you followed the instructions in the previous step, you are ready to submit support requests. Providing these items in your request will speed-up the process:
Your Project ID
Your workspace name
Your Bucket ID, Submission ID, and Workflow ID
Any useful log information
You may also be asked to share your workspace with the support team. To do this, add the email address GROUP_FireCloud-Support@firecloud.org to your workspace by clicking the Share button–the option is located in the three-dots menu at the top-right.
7. Cleaning up
My fifth run was successful! Now it was time to clean-up.
After learning how to use this workflow and running it unsuccessfully a few times, I had amassed a significant amount of storage. To wit:
$ gsutil du -s gs://my-terra-bucket-id
3,994,577,017,810  gs://my-terra-bucket-id
Holy smokes–about 4 terabytes, which costs more than $50 USD per month using standard Google cloud storage. At runtime, you can automatically delete intermediate files with an option that removes files for workflows that complete successfully. Since I was learning, I kept them around and then used the Remove_Workflow_Intermediates notebook to remove them manually.
To begin cleaning-up, I removed all subdirectories with failed runs (but not the notebooks directory):
The spinning circles show the directories that I manually deleted. Be sure to keep the “notebooks” directory.
Next, I looked at the size of the directory from my successful run, about 864 gigabytes:
$ gsutil du -s gs://my-terra-bucket-id/my-submission-id
863,761,741,217  gs://my-terra-bucket-id/my-submission-id
To manually delete the remaining intermediate files, I copied this notebook to my workspace. Note: Before running it, I upgraded to the latest version of pip and google-cloud-bigquery with this command:
Within the notebook code, I also modified the pip command to upgrade to the latest library versions with this command:
!pip install --upgrade $install_cmd
The program found 463 intermediate files to delete (Note: 782.61 GiB = 840 gigabytes).
WARNING: Delete 463 files totaling 782.61 GiB in gs://my-terra-bucket-id (Whole-Genome-Analysis-Pipeline)
Are you sure? [y/yes (default: no)]: yes
After executing the cleanup code, I reduced total storage for the successful run by 97%, from about 864 to 23 gigabytes, which now costs less than $0.50 USD per month using standard Google cloud storage. The largest savings came from storing the uncompressed BAM file (previously 80 gigabytes) as a compressed CRAM file (16 gigabytes). My take-home: It pays to pay attention to unnecessary files!
Conclusion
After building uBAM files correctly, reprocessing my genome would typically cost about $7 USD and three days of compute time. It took five runs to get it right, but Terra’s call caching magic–and perhaps the additional CPU power that I requested–brought the last runtime down to 14 hours. It has been a steep climb, but the views are great. Next up: reprocessing WGS data for the rest of our family, and then joint variant calling.
This entry was cross-posted from Terra on April 28, 2021.
In April, we celebrate Citizen Science Month, World Autism Day, and National DNA Day. In this guest blog post, all three events come together as KT Pickard, father of a young woman with autism, shares his family’s story of personal genomics and citizen science.
This past Sunday was National DNA Day, which commemorates the discovery of DNA’s double helix in 1953 and the publication of the first draft of the human genome in 2003. Events on National DNA Day celebrate the latest genomic research and explore how those advances might impact our lives. Last year, I wrote a playful article for DNA Day that investigated whether genetics is truly like finding a needle in a haystack. This year, our family is honored to share our story and ideas with you.
Our family’s DNA odyssey
My wife and I have a young adult-aged daughter who is on the autism spectrum. We first discovered that our daughter had autism when she was eight years old. As we struggled to understand autism and what it meant for our family, we learned that autism is uniquely expressed: Meeting one person with autism means that you have met one person with autism.
Long fascinated with genomics, my wife and I wondered how our DNA may have contributed to her condition, and we set out to learn all that we could. It was the beginnings of this diagnostic odyssey that gave expression to my second career as a citizen scientist. My professional background in supercomputing, software engineering, and medical imaging were a good start to apply scientific principles and gain insights.
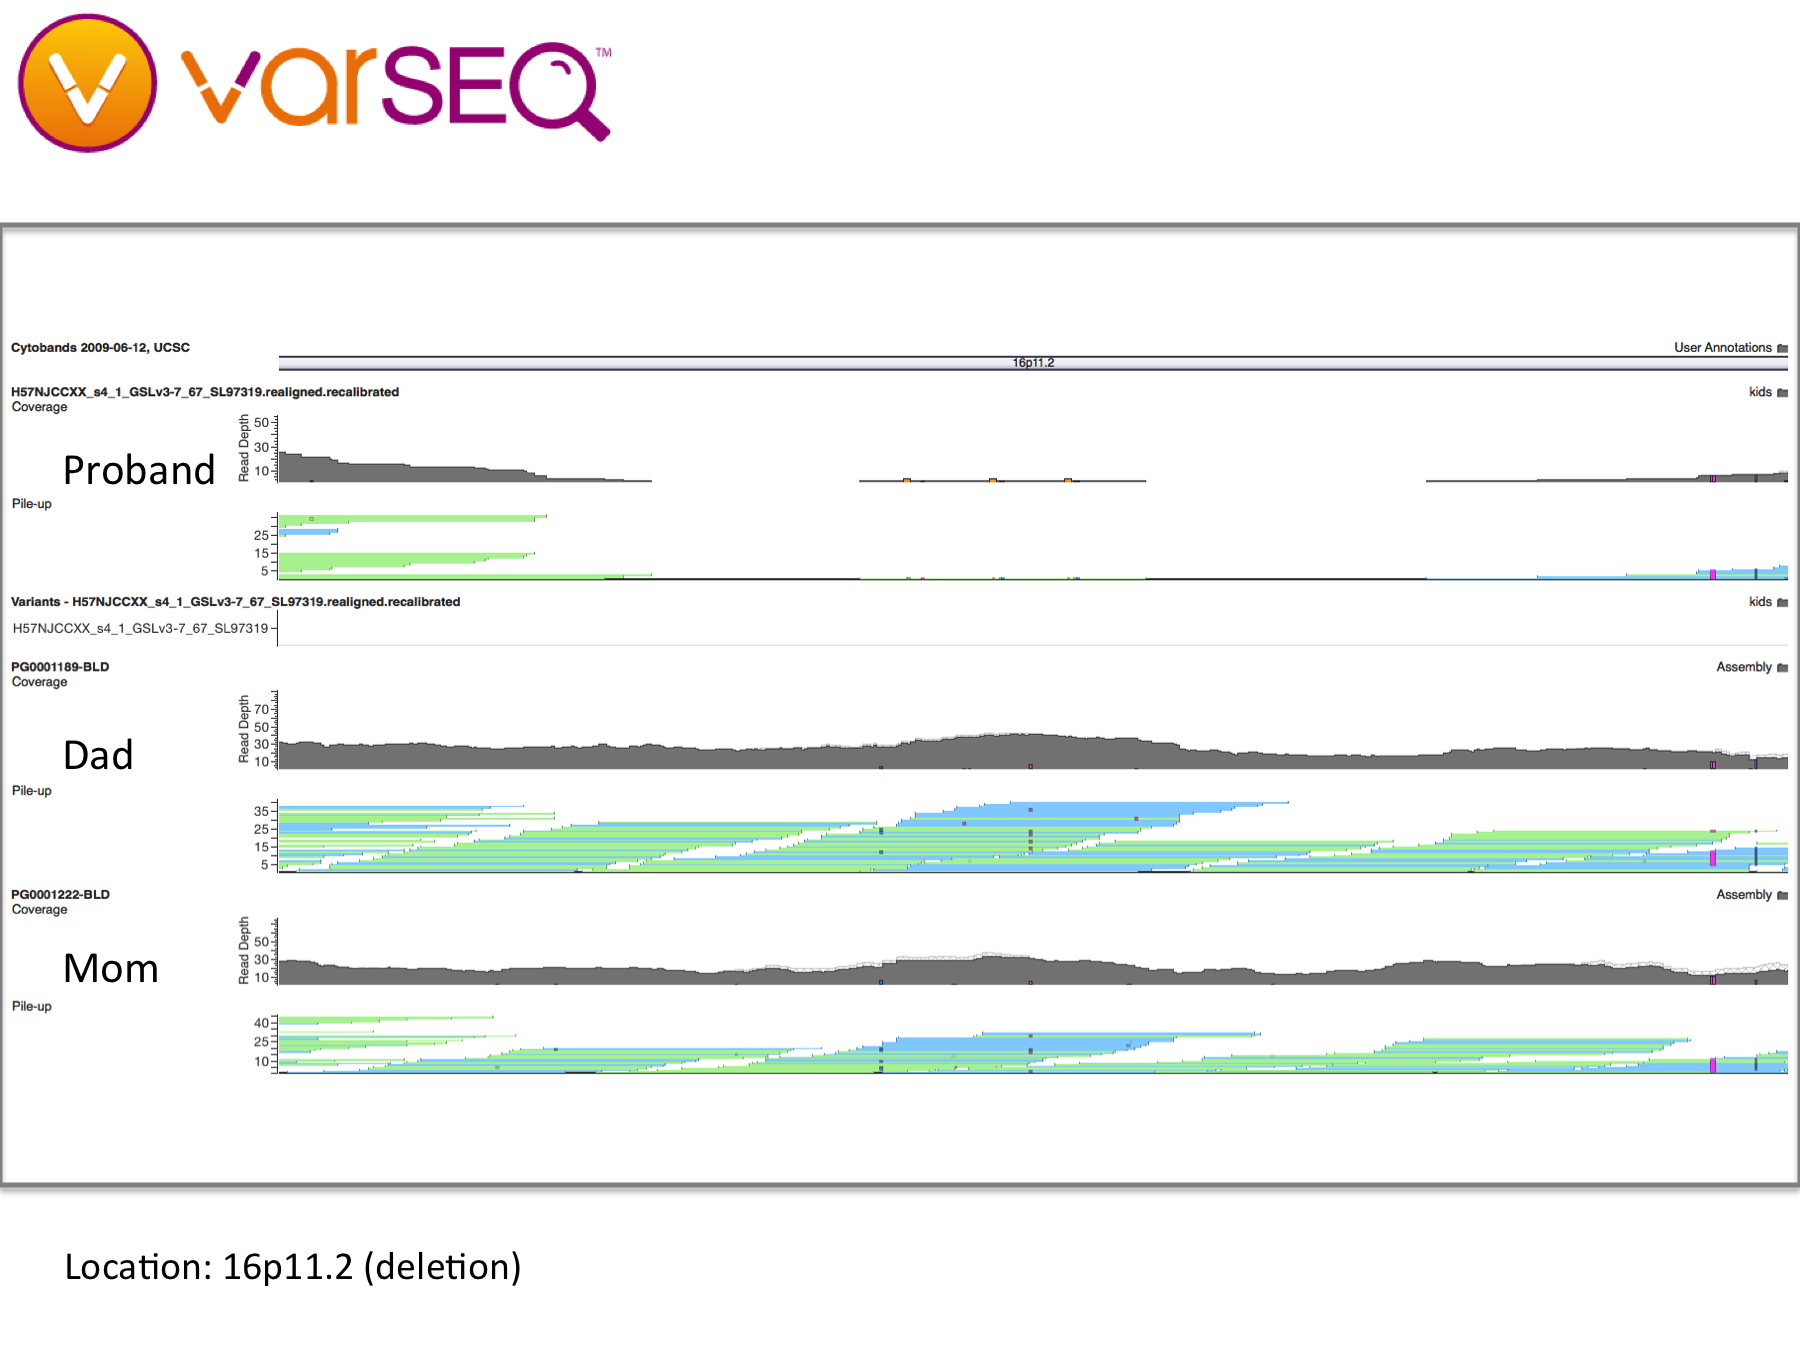
We began our journey by talking with our family doctor, then my wife and I had our whole genomes sequenced through the Understand Your Genome project. Later, we crowdsourced the sequencing of her genome and began looking for genetic clues. By applying trio analysis to our family data, we discovered some preliminary findings: Our daughter has deletions in the NRXN1 gene and in a large region of chromosome 16, which have been found to be widely associated with developmental issues including autism. It looks like my wife and I have each contributed some variant alleles, but we are being careful about interpreting these findings because our WGS data and our daughter’s were processed through different pipelines, which could lead to inconsistent results.
Trio analysis of the NRXN1 locus shows a compound heterozygous deletion, with each parent possibly contributing one allele (visualization by VarSeq from Golden Helix).
To continue our journey, I want to reprocess our family’s WGS data with the latest GATK Best Practices, in the hope that this will give us a consistent baseline. I came across Terra through the book Genomics in the Cloud, which I picked up to help me learn more about GATK. I led an online book club in early 2021 based on the book, and subsequently moved our WGS data to the Terra platform. Now I am using the GATK Whole Genome Analysis Pipeline in Terra to reprocess our data. Working with Terra has been challenging, but highly satisfying because it provides access to industry standard genomics tools.
From personal genomics to citizen science
My family’s main goal with this project is to make meaningful discoveries about the genetic basis of our daughter’s autism. In 2015, genetics could explain the heritability of autism spectrum disorder in approximately 1 in 5 cases. Amazingly, that number has increased to 4 in 5 cases today.
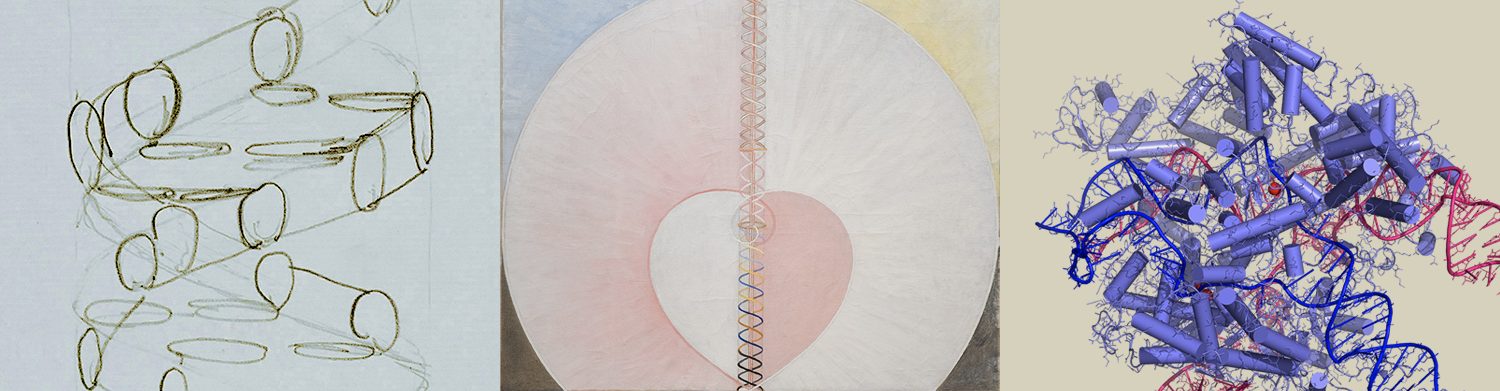
Our daughter (who drew this image) is on the left. At the time, she represented the 1 in 5 people whose autism could be explained by genetics.
Yet there is more to be gained. Although whole genome sequencing may not provide directly actionable results for autism itself, WGS can make a huge difference for parents who discover a comorbid, but treatable condition. By sharing our data and our findings with others, we can accelerate medical knowledge.
A growing number of projects offer opportunities for non-scientists to contribute in various forms to the advancement of biomedical research. In U.S. healthcare, one of the largest citizen science projects—All of Us—seeks one million people to share their unique health data to speed up medical research. By creating a national resource that reflects and supports the broad diversity of the U.S., the goal of All of Us is to advance precision medicine for all.
We have enrolled in the All of Us project and are looking forward to doing our part. I find it inspiring that this is something we can all contribute to, as citizens, even those of us who are not researchers.
Looking to the future
At its core, citizen science is a collaboration between scientists and those who are curious and motivated to contribute to scientific knowledge. As our family’s odyssey unfolds, I like to reflect about what I see out here on the bleeding edge of research, and how it could be applied to improve outcomes for patients in the real-world.
In community practice, many medical providers have limited knowledge of autism. Due to a lack of effective data sharing and awareness, an undiagnosed person with autism who walks through the door of a hospital may appear like a rare disease patient. A clinician evaluating them would miss out on a huge amount of valuable context. How could we improve the system so that clinicians could more effectively recognize the underlying context of that person’s condition? We can address some of these issues with machine learning, but that requires pooling together huge amounts of data, and much of that data is difficult to access.
As a citizen scientist, I see an enormous opportunity to combine research data with real-world data and evidence across healthcare delivery organizations. Common ontologies and interoperability standards are making it increasingly easy to pool de-identified datasets to test hypotheses on synthetic data—realistic-but-not-real data—to gain insights. A recent “call to action” encourages citizen scientists to evaluate the utility of this method precisely because data can be shared without disclosing the identities of anyone involved. Done ethically and responsibly, this synthetic DNA approach has the potential to accelerate autism research and deliver new benefits to patients.
This is the perspective I have gained from my journey so far. By asking questions and continuing to discover more about what our genomes contain, I have been fortunate to learn much about scientific principles, bioinformatics, and a bit about the genetic basis of autism. Although it is at times a challenging road, I have found that the path of personal genomics and citizen science is a satisfying way to find answers to the questions that my family faces. I hope this story will inspire others to explore, and perhaps let researchers and clinicians see patients and their families as potential collaborators in the quest to understand complex conditions like autism.
[Update: 2021-01-10: Thank you for your interest in our book club. We are currently closed to new members, but you can watch and subscribe to our meetings on the Genomics in the Cloud Book Club channel on YouTube.]
Introducing the Genomics in the CloudBook Club, an online discussion group. Our 35+ members across 10 time zones are covering one chapter each week, and we expect to complete the book in March 2021.
For a chapter synopsis, please read this Twitter thread from one of the authors, Geraldine A. Van der Auwera. My book review is available on Amazon.
Taking a page from the R for Data Science Online Learning Community, we created a Slack account for discussions and a Zoom account for meetings. Last week, we had lively online conversations about reference genome diversity, workflow language selection, personal whole genome sequencing, reproducibility tips, and more.
After each meeting, we post the video to this GITC Book Club channel on YouTube so you can follow us anytime. Our member’s tweets are also available here. Thank you for tuning in!
In this post, I explain how I created FASTQ files from a BAM file using a utility called Picard (no relation, although I pronounce my name the same way).
One of the limitations of the family trio work was that the bioinformatics pipelines were different between our samples and our kids’ samples. To fix this limitation, I had to “reconstitute” the original FASTQ files from the BAM file provided by Illumina and then re-run all our data through the same pipeline. (Note: To my knowledge, UYG no longer provides BAM files as part of this program.)
You can create FASTQ files from your BAM file by using Picard, a set of Java-based command line tools for manipulating high-throughput sequencing (HTS) data in formats such as SAM/BAM/CRAM and VCF.
Running Picard
For reasons that escape me now, I first ran Picard using an AWS t1.micro instance.
Facepalm: I attempted to run Picard using an AWS t1.micro instance. Source: Paramount
After 3 attempts–watching Picard fail after running for 3 days each time–and creating thousands of temp files in the process, I learned the hard way that Picard requires more than 613 MBytes of memory. This time, I used a c4.2xlarge instance (4 cores, 16 GBytes of memory), which worked. It appears that 16 GBytes is about the minimum amount of memory to get the job done.
Step 1. Is your BAM file sorted?
Before creating FASTQ files, make sure your BAM file is sorted so that your genome coordinates are in order. One of the ways to do this is with samtools, a suite of programs for interacting with HTS data. Here are the commands I used to install it. You can check whether or not your BAM file is sorted by using this command:
samtools stats YourFile.bam | grep "is sorted:"
# "is sorted: 1" = Yes, your BAM file is sorted.
# "is sorted: 0" = No, your BAM file is not sorted.
If your BAM file requires sorting, use this command (or something close to it):
# Type "samtools sort --help" for a description of this command
samtools sort -n -@ 2 -m 2560M InputFile.bam -o ./OutputFile.sorted.bam

# Check for existence of Read Groups (@RG)
samtools view -H InputFile.bam | grep '^@RG'
Step 2. Run Picard
Get Java and the picard.jar file. Run this command, but keep in mind that the options below are for a BAM file created on an Illumina HiSeq sequencer:
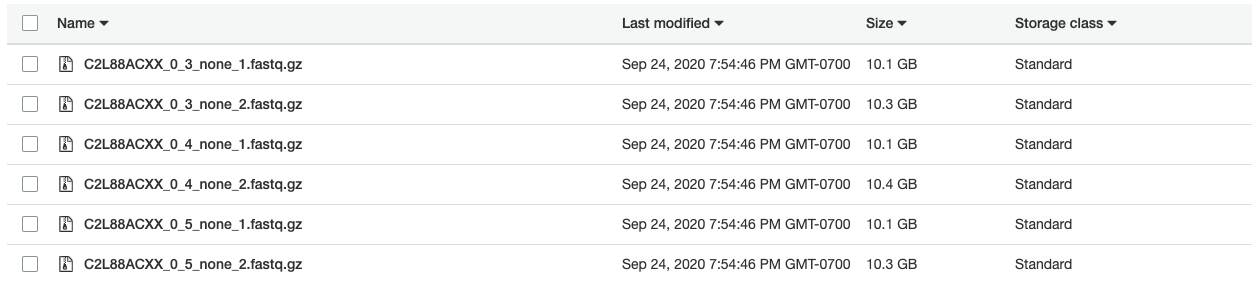
Using the c4.2xlarge instance, I ran Picard in 3 hours to create the FASTQ files shown below. In addition, creating compressed (gzip) versions of the files required another 8.5 hours of compute time. With an on-demand price of about $0.40 per hour, creating compressed FASTQ files cost approximately $4.60 USD on AWS.
In 2014, I uploaded my WGS data to the cloud and made it publicly available. In a previous post, I explained why I moved my WGS data from DNAnexus to Amazon. In this post, I explain the final step: attaching the S3 bucket to a web server. The goal was to replace the ftp server with a web server and make it easier to download my whole genome sequence data.
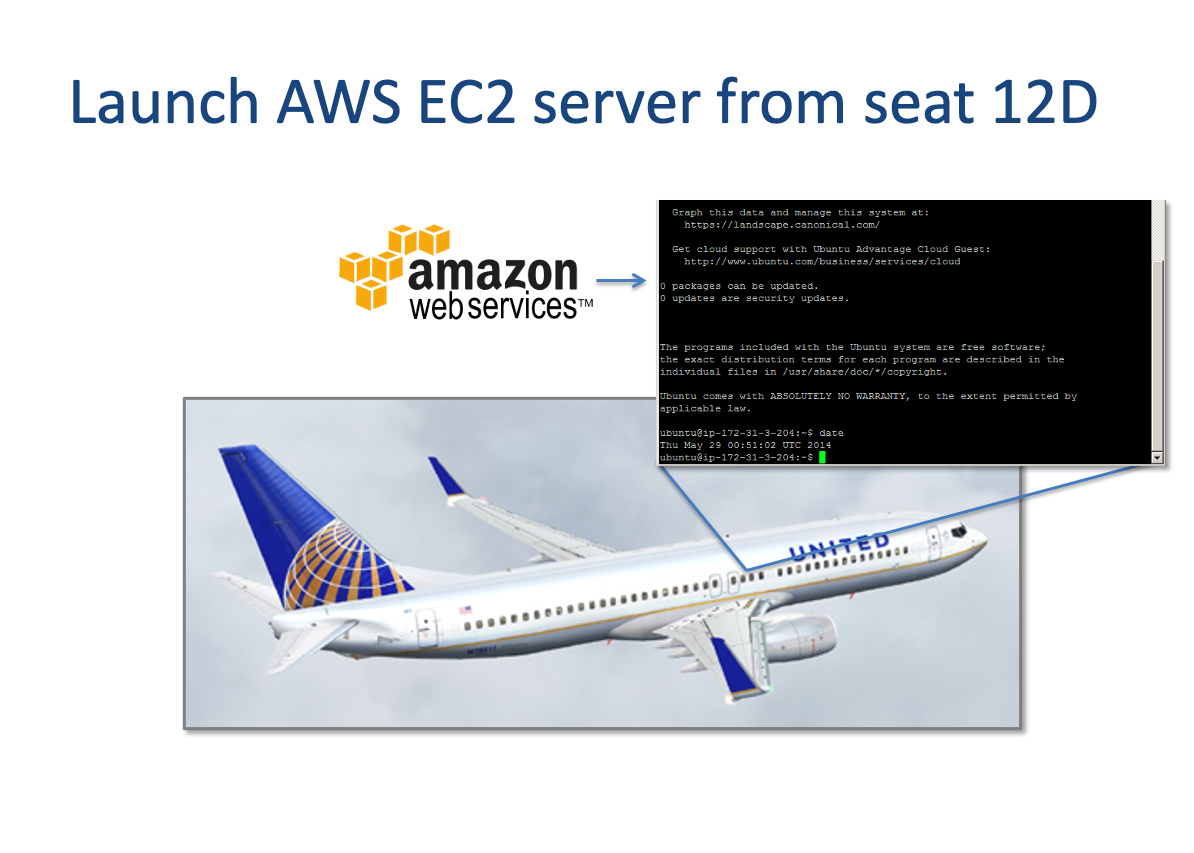
I launched my first cloud server literally while in the clouds in May 2014. Cloud computing has changed so much, it’s unbelievable. Back then, I had to patch the Linux kernel by hand so that the ftp server would work on AWS. Today, uploading your genome using Amazon’s command line interface (CLI) to an AWS S3 storage bucket is relatively easy. Understandably, Amazon makes it challenging (but doable) to make your storage publicly available. I used the Apache Web Server and s3fs to share this information.
My first cloud server
Step 1. Install Apache
Depending on your flavor of Linux, your commands may vary. I am using Ubuntu 18.04 LTS running on a t2.micro EC2 server. Here are the commands I used to install the Apache HTTP Server.
Step 2. Install s3fs
s3fs allows allows you to mount an S3 bucket via FUSE. s3fs preserves the native object format for files, allowing use of other tools like AWS CLI. Again, your commands may vary depending on your flavor of Linux. Here are the commands I used to install s3fs.
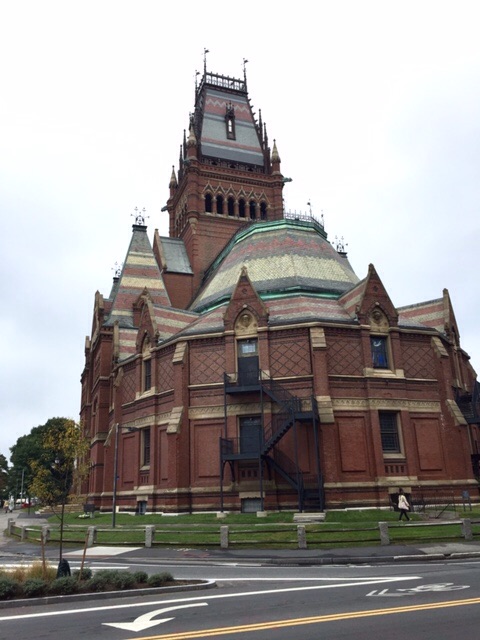
Hosted by the Mind First Foundation, this conference enabled participants in the Personal Genome Project to hear first-hand how their health data could be used in research, especially mental health research. The second day of the conference, the “PGPalooza,” let PGP participants directly interact with researchers to select projects of interest and have their questions answered immediately.
James Tao graciously edited this 25-minute video of my talk about family trio sequencing and autism:
Also, special thanks to Alex Hoekstra, co-founder of Mind First, for the invitation to this event.
In this blog post, I look at whole genome sequence platforms for storage and discuss what might happen to “genomical” amounts of data.
Background
When I uploaded my whole genome sequence in September 2014 (about 10 months ago), few options existed for sharing personal genomic data. The usual suspects (Dropbox, Evernote and Figshare) were prohibitively expensive for large amounts of data. I knew about DNAnexus, but I saw it as a platform for researchers, not consumers. Well, times have changed. Fast.
A Battle of Platforms?
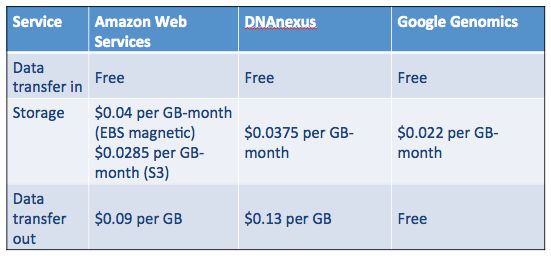
In addition to my original “roll your own” approach, DNAnexus and Google Genomics have emerged as major players for end-to-end genomics workflow. In the table below, you can see that storage costs for AWS S3, DNAnexus and Google Genomics are roughly the same. Everyone provides free uploads (we want your data!), but the cost for transferring data out of the systemvaries. Google Genomics does not charge for this, but instead charges for API access. For my current AWS storage, I pay about $4 per month to store my genome.
Table 1. Comparison of AWS, DNAnexus and Google Genomics storage costs. Your mileage may vary. Accessed July 7, 2015.
Ultimately, I selected DNAnexus over Google Genomics because their workflow API is well-developed and appealed to my roll-up-your-sleeves sensibility. (If you’re comfortable with command-line work, this platform is for you. BaseSpace, GenoSpace and Galaxy are other platforms to consider.) Google Ventures backed DNAnexus in 2011, so it’s difficult to predict what will happen in the long run. What we do know is that the value of their respective platforms will increase as more people join (and add data) to them. Google Genomics has partnerships with DNAstack, Autism Speaks and even DNAnexus. DNAnexus has partnerships with Baylor College of Medicine, WuXi NextCODE, and the Encode Project. The battle begins. If these two platforms can maintain standards-based interoperability, the competition is good for everyone.
Astronomical becomes Genomical: A Perspective on Storage
In this recent article about big data and genomics, the authors compare the field of genomics with three other Big Data applications: astronomy, YouTube and Twitter. In common with genomics, these domains: 1) generate large amounts of data, and 2) share similar data life cycles. The authors examine four areas–acquisition, storage, distribution, analysis–and conclude that genomics is “on par with or the most demanding” of these disciplines/applications. My previous experience in medical imaging (a field that arguably tackled the prior generation of “big data” issues) leads me to believe that genomics will come to epitomize Big Data to many more people before long.
If you look carefully at the projections in the figure above, we may run out of genomes to sequence (really?), which brings us back to storage. Where will we store all of this sequence data, especially as genomic medicine continues its inexorable move to the clinic?
Delete Nothing and Carry on
If the field of medical imaging is an indicator, deleting anything after it has been archived is the exception rather than the rule. The main reason for this is medicolegal — hospitals avoid the liability of not being able to recall an exam later by keeping everything. Although the incidence of requiring access to images after diagnosis is low, the consequence of not having access to the original diagnostic image is high. A former colleague suggested that about 5% of their medical archive customers use lifecycle management features to delete imaging exams. In medical imaging, customers more commonly use lifecycle management features to migrate images to less expensive storage devices over time. So, in genomics, you might migrate your sequence data stored on Amazon from solid state storage (most expensive) to S3 to Glacier (least expensive). But my best guess: we’ll delete nothing and carry on.
Yesterday, I presented preliminary findings at the 2015 Clinical Genome Conference in San Francisco from our family trio sequencing project. In this crowdsourced project on experiment.com, I looked for genetic clues to autism in our adult-aged daughter. While the talk focused on the “DIY” aspects of how to accomplish WGS sequencing, this post focuses on genetic findings.
Overview
The project began with a crowdsourced effort to raise $1,750 to sequence our daughter’s genome, and took slightly more than two months to complete. After working with AllSeq and HudsonAlpha to obtain WGS data, we used VarSeq from Golden Helix to search for unique variants, as well as browse whole genome sequence data. After filtering our variant call data to focus on high quality exome variants, we examined 52 potentially damaging de novo and compound heterozygous changes suggested by VarSeq’s family trio analysis. Although this first approach did not yield clues specific to autism, it did suggest a number of secondary findings that are not addressed here. The second approach was to start with genes having known associations with autism and then look for them in our daughter’s DNA. Several curated databases have between 200 and 1200 genes, but again, none produced meaningful results. The third method was to look at known “hot spots” in autism genetics, such as variants in the NRXN1 gene, as well as known structural variation on chromosome 16. Changes to NRXN1 and so-called “16p” changes are discussed below.
Findings
NRXN1 – Deletions in NRXN1 are associated with a wide spectrum of developmental disorders, including autism. Our daughter has a 10bp exonic deletion (-GT repeat) followed by what appears to be a 9bp compound heterozygous deletion in NRXN1. Both deletions are partially present in both parents and overlap; the deletions appear to have been accumulatively inherited. Due to the high number of sequence repeats, copy number variation (CNV) should clarify the significance of this finding.
16p deletions – Deletions and duplications in this 593-kilobase section of chromosome 16 are widely associated with developmental issues, including autism. Our daughter appears to have dozens of deletions in this region, some inherited and some not. However, since the variants in our daughter’s DNA were called using a different software pipeline, it is difficult to draw meaningful conclusions (see “Limitations,” below). For example, some variants in our daughter’s DNA were shown to map to multiple locations on the genome, suggesting either large copy number variation or genomic regions that were difficult to map. Copy number variation (CNV) analysis will also elucidate this region. Once reprocessed, these findings may provide potential genetic clues to our daughter’s condition.
Limitations
My wife and I received our WGS data in March 2014. Our samples were sequenced at 30x coverage using Illumina’s HiSeq platform and then aligned and called with Illumina’s pipeline, Isaac. Our daughter’s DNA was sequenced in May 2015 at 30x coverage, but on Illumina’s newest platform, the Illumina HiSeq X Ten. The difference is that our daughter’s DNA was aligned using BWA, followed by variant calling with GATK “best practice” workflow. To accurately compare genomes in family trio analysis, all samples must be processed using the same software pipeline. Otherwise, variants may be aligned and called differently. My wife and I must go back to the (almost) original FASTQ data and start over. Although Illumina did not provide these files with our results, Mike Lin explains how to extract FASTQ files from Illumina data in this great blog series. Hint: it involves a utility called Picard (no relation). Until we reprocess our WGS data using the same bioinformatics pipeline, all results should be considered preliminary.
Conclusion
This project demonstrated that personal genomics is very real, and has the potential to answer complex medical questions. Today, answering those questions using whole genome data and family trio analysis requires a combination of genetic, bioinformatic and domain knowledge to reach meaningful conclusions. Validating those conclusions remains challenging, from rare diseases to complex conditions such as autism. Currently, personal genomics has a similar feel to “homebrew” computer clubs from the late ’70s–the community is still very small, collegial, and willing to share “tips and tricks” to advance the field.
Although we encountered some “dark alleys” during the analysis, our preliminary results suggest that family trio sequencing can indeed provide genetic clues to autism. We will continue to refine the analysis by reprocessing the data with the same pipeline, which should resolve questions in the 16p region, as well as the potential deletion in NRXN1. Further, CNV analysis should answer structural variation questions that are also known to be associated with autism spectrum conditions.
Acknowledgements
I would like to thank our backers and the team at experiment.com, as well as Gabe Rudy from Golden Helix. Gabe was very generous with his time, knowledge and insight. Finally, I would like to thank my wife, Kimberly, for her patience and fortitude.
This entry was cross-posted from DNAdigest on April 22, 2015.
Amazingly, the cost of whole genome sequencing is now 100,000 times less expensive than it was a dozen years ago. If the Tesla Model S followed this trajectory, you could buy one today for less than $1 USD. This super logarithmic decline puts genomics on par with desktop publishing or 3D printing—it has become something that you can affordably do yourself.
My wife, Kimberly, and I were excited about the prospect of having our genomes sequenced. Our daughter has autism, and like many parents of special needs children, we were eager to explore the underlying causes of her condition. We “got genomed” last year by enrolling in Illumina’s Understand Your Genome program. We received our whole genome sequencing (WGS) data, as well as limited predisposition and carrier screening for a number of Mendelian traits. As many DNAdigest readers know, the cost of WGS continues to drop in price, almost to the $1,000 genome that Illumina announced last year. Kimberly and I were intrigued to learn that we were both carriers of some rare genetic variants. Could our genetic idiosyncrasies be contributing to our daughter’s autism?
After being sequenced, I followed the lead of DNAdigest contributor Manuel Corpas and posted my whole genome sequence online. I decided to publish my genome without restrictions in an attempt to lead by example. In the future, platforms like Repositive will make it easier for consumers to share genomic information and maintain privacy.
Kimberly and I recently launched a project on experiment.com to crowd fund the whole genome sequencing of our adult-aged daughter. In this project, we will look for genetic clues to her autism using family trio sequencing. Family trio sequencing is a powerful technique that can explain genetic conditions by looking at differences in DNA between Mom, Dad and an affected child.
We were thrilled when the sequencing project was funded the first day. In the process, we received feedback from other parents who wanted to learn more about the technique, so we added a stretch goal to cover publishing costs in an open access journal. The research paper will document our findings, as well as explain how family trio sequencing can be used to search for answers to health conditions and rare diseases.
Information sharing can indeed be very personal, but we find the possibility of catalyzing new areas of health research compelling. With this project, we hope to find clues that will contribute, if only in a small way, to a growing body of genomics research that supports a broader explanation of autism.


 Our daughter has autism, and like many parents of special needs children, we were eager to explore the underlying causes of her condition. We “got genomed” last year by enrolling in Illumina’s