A tale of cancer and genetics: part 2 of 4

Summary: My wife had breast cancer. These posts describe: 1) finding out, 2) genetic testing, 3) radiation therapy, and 4) an incidental finding in the APC gene.

An image of left-handed DNA, because our lives were twisted backwards at this point.

Genetic testing

The day after Kimberly received her breast cancer diagnosis, we met with a board-certified genetic nurse, Frank. Before our visit, we completed a form that Frank used to create a family pedigree. The list below is not a pedigree, but it shows the history of cancer in Kimberly’s family. We removed kinship for privacy:

  1. Breast cancer (maternal side: 1, paternal side: 1)
  2. Lung/bone cancer (paternal: 3)
  3. Cervical cancer (maternal: 1)
  4. Colon cancer (paternal: 1)
  5. Liver cancer (paternal: 2)
  6. Kidney/bone cancer (paternal: 1)
  7. Esophageal cancer (paternal: 1)
pedigree
Example hereditary breast and ovarian cancer in a pedigree chart

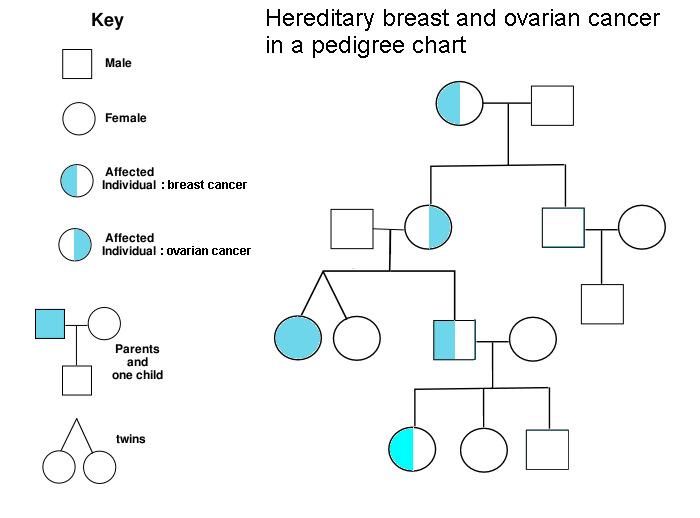
It turns out that 5-10% of cancer is inherited. People who carry hereditary mutations do not necessarily get cancer, but their lifetime risk is higher than average. Genetic counselors use pedigree charts to visualize family history and evaluate when genetic testing adds diagnostic value. Kimberly’s family history met lab guidelines for further evaluation, so Frank ordered a gene panel from a nearby lab, Invitae. The blood test was ordered stat, and we received our results six business days later. Treatment plans can change based on genetic results, so we were grateful to receive results before her surgery, which was now scheduled.

We returned to Frank’s office and first learned that she does not carry mutations in 9 genes known to influence the risk of breast cancer: ATM, BRCA1, BRCA2, CDH1, CHEK2, PALB2, PTEN, STK11, and ΤΡ53. Phew! Invitae also provides free hereditary cancer testing to breast cancer patients at no additional charge (as long as you order the expanded panel within 90 days of the original test), so Frank ordered the expanded panel. Given that Kimberly has a family history of other hereditary cancers, we welcomed a broader genetic search. The results could be meaningful not only to us, but also to other living relatives. Oddly, our insurance company rejected all of our genetic testing claims because the resubmission was not related to her breast cancer diagnosis. I discussed the situation with Invitae and they were very accommodating–our total out-of-pocket cost was $250. I am still mad at our insurance company, but that’s a rant for another day.

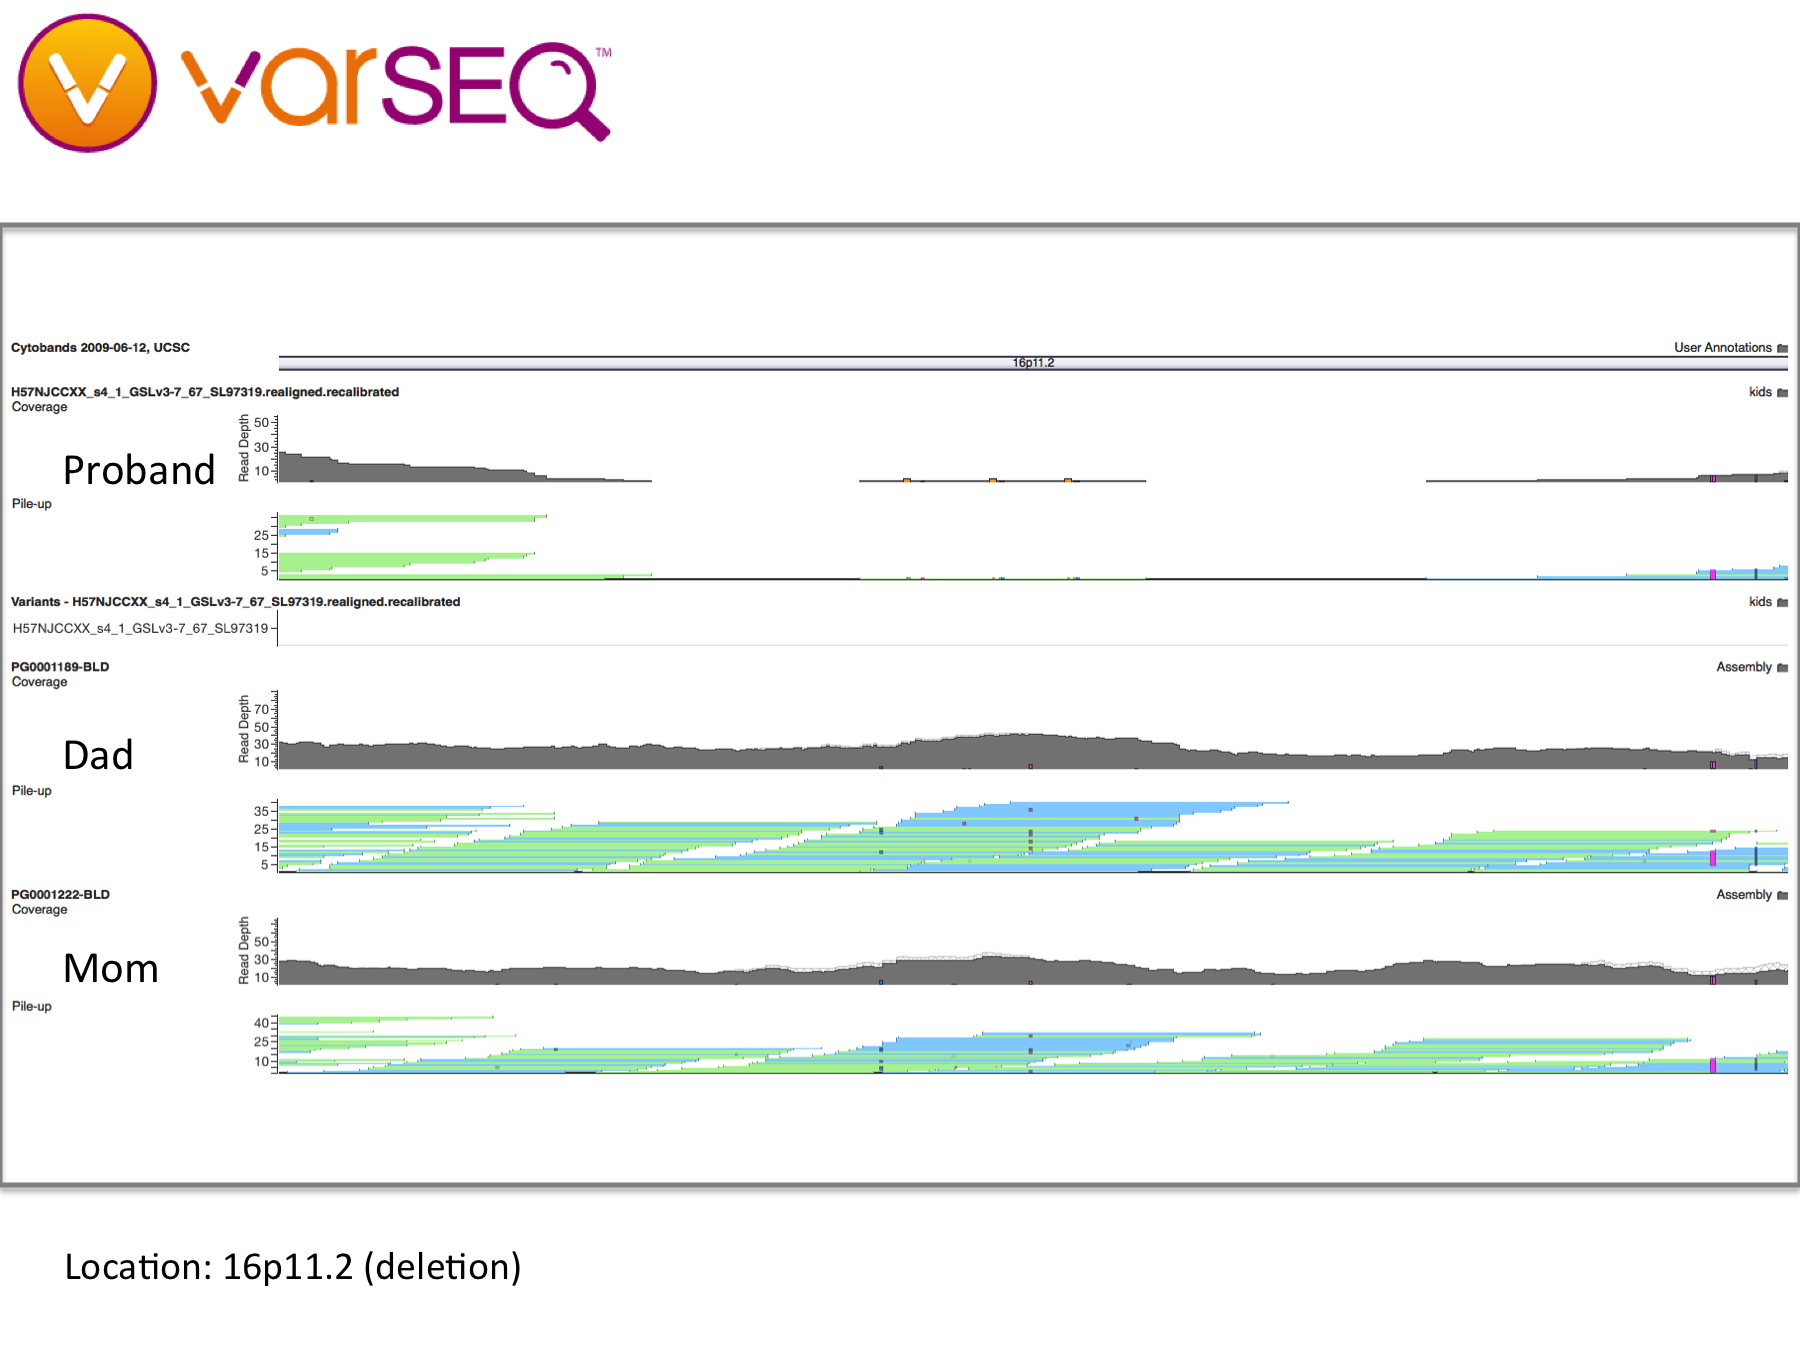
Although she did not have any mutations related to breast cancer, Kimberly’s expanded genetic testing revealed a point mutation in the APC gene, which is known to increase the risk of colorectal cancer. People with this variant are generally counseled to have their first colonoscopy at age 40 (she did that) and follow-up colonoscopies every 5 years (coming up). Since the APC I1307K variant is autosomal dominant, close relatives such as siblings and children have a 1 in 2 chance of inheriting an APC mutation. We called Kimberly’s sister and shared our findings, part of a cascade testing strategy. We also have our kid’s whole genome sequences, which will let us check for APC mutations directly. We will return to that search in part 4 of this series.

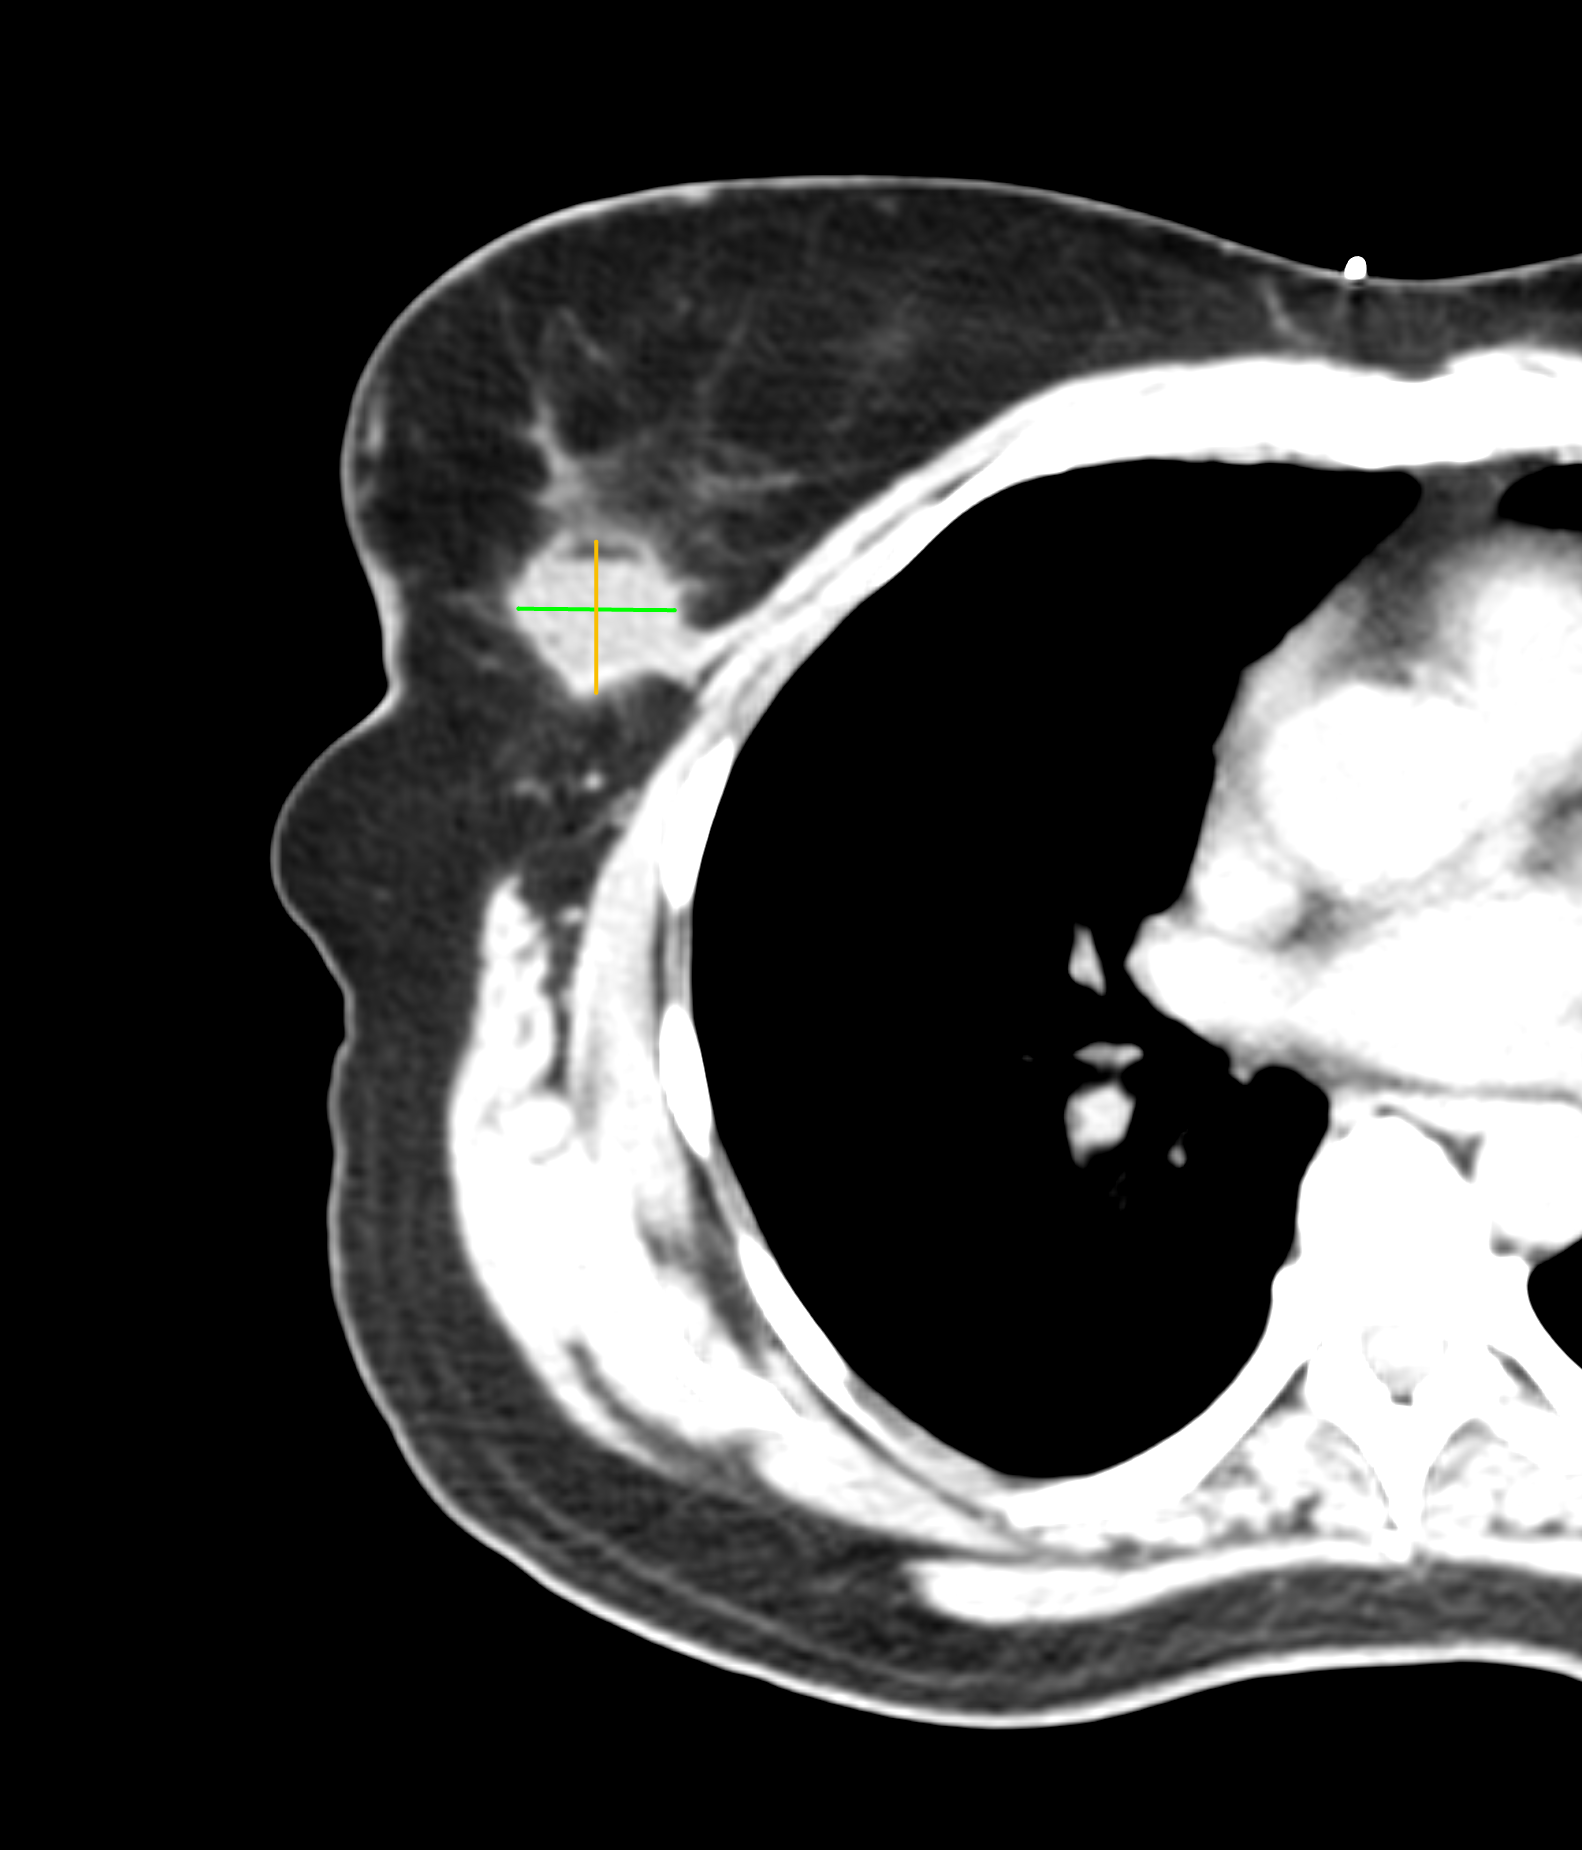
We left Frank’s office and developed a treatment plan with Kimberly’s surgeon and medical oncologist a few days later. The plan included surgery (lumpectomy) followed by radiation therapy. Surgery was successful, as you can see in the before and after images below. (Special thanks to the Horos Project for the open source DICOM viewer.)

Before surgery

pre-operative images
Pre-operative images. Left: Diagnostic mammogram. Lesion is visible in the upper right quadrant. Right: Ultrasound with tumor measurements (0.8 cm x 0.6 cm).

After surgery

Post-operative image. CT scan after lumpectomy (3 cm x 3cm).

Kimberly received her diagnosis the day after Thanksgiving. In the 18 days that followed, we had 16 medical appointments that took us from diagnostic mammogram to surgery. With surgery behind us, Christmas was now six days away. We spent a quiet holiday with the kids.

We began 2020 hopeful, knowing that her type 1A tumor had been successfully removed by her surgeon. We were also much more knowledgeable about hereditary cancer risks due to Frank’s counseling.

One month later, Kimberly would begin radiation therapy to dramatically decrease her chance of recurrence.

/2

A tale of cancer and genetics: part 1 of 4

Summary: My wife had breast cancer. These posts describe: 1) finding out, 2) genetic testing, 3) radiation therapy, and 4) an incidental finding in the APC gene.

Leavenworth National Cemetary, November 29, 2019 (photo credit: Hannah Pickard Photography)

Finding out

It was the day after Thanksgiving. My wife Kimberly was talking with a nurse about the results from a biopsy performed 2 days earlier. She hung up her mobile phone and burst into tears. Kimberly received the call while we were exiting the gates of Leavenworth National Cemetary in Kansas, where we had just laid my mother-in-law Barbara to rest with her husband, Gilbert. Our kids were in the back seat and did not really know what was going on, but they guessed that mom had cancer.

The week prior, Kimberly had a diagnostic mammogram, and the radiologist told us in person that Kimberly had a suspicious lesion in her right breast (larger than a peppercorn, smaller than a pea) and recommended a biopsy. Luckily, a biopsy appointment was available the day before Thanksgiving, and we took it even though we were flying to Kansas City the next day. We asked the care coordinator to call us as soon as she had preliminary pathology results, and she did. Our family flew home to the San Francisco Bay area on Sunday.

On Monday, Kimberly and I visited the medical oncology department of a nearby clinic. The nurse said that Kimberly had invasive ductal carcinoma. Surprisingly, the rest of the visit did not turn into that dull surreal buzz that often accompanies bad news and drowns out everything else. In our case, years of being in rooms like this one discussing the needs of our exceptional children proved immensely useful. I took notes and Kimberly asked incisive questions about treatment options, radiation therapy, and genetic counseling. The nurse patched-in our long time family physician over the phone, and his presence was very assuring. It was a brief respite from what would become an overwhelming 3 month journey–the first 2-3 weeks especially so. We learned about a bewildering array of cancer treatment options, visited competing medical facilities, and evaluated new doctors.

We drove home and I read the Wikipedia entry for invasive ductal carcinoma. It was the prognosis section that caught me completely off guard:

Overall, the five-year survival rate of invasive ductal carcinoma was approximately 85% in 2003.

Reference: https://doi.org/10.1186/bcr767

Those odds were not good, and I had multiple panic attacks over the next few weeks at the thought of losing my wife. “Hang in there. Moment by moment,” a friend texted to me. I read that message over and over, hanging on.

/1

Why I moved our WGS data from DNAnexus to Amazon S3

$1,500. That’s the amount of money I have spent over the past 5 years to store our family’s whole genome sequence (WGS) data. For $299 per person in 2020, I could sequence all of us again at 30x coverage, get the same data files, and spend less money. In 2015, I wrote about posting my WGS data to DNAnexus. Last month (July 2020), I moved all of our data to Amazon (AWS) S3 storage. In this post, I explain why.

Five years ago, my impression was that DNAnexus was a platform for researchers, not consumers. It turns out that my first impression was correct–DNAnexus is not a platform for consumers. To their credit, their platform-as-a-service model includes an extensive set of genomic analysis tools, an easy-to-use SDK, top-notch documentation. a way to run your own docker images using Workflow Description Language (WDL), and a professional services team. DNAnexus’ IT infrastructure and regulatory compliance make the platform valuable for over 100 enterprise customers, and their recent $100M funding round coupled with their UK Biobank/AWS announcement will enable the company to expand into new markets and let researchers find more actionable insights.

DNAnexus Platform-as-a-Service

Nevertheless, I recently moved my WGS data to Amazon S3 due to storage costs and a lack of price transparency.

Storage costs

I’ve learned that most of the work that I want to do can be done with VCF files. Yes, there are times when I want to look at BAM files, but moving those files to lower-cost storage makes sense. DNAnexus introduced a Glacier-based archiving service in 2019 to support those operations, although I did not use it. My BAM file is 73 GBytes, which represents about 93% of the 79 GBytes for my WGS data (no FASTQ data). If I deeply archive BAM and FASTQ data (329 GBytes total), I can reduce the amount of higher-cost storage by 98%. The cost comparison for a single genome with FASTQ files looks roughly like this:

  • Storage cost on DNAnexus: (329 GBytes * $0.03 per GB-month [everything]) = $9.87 per month
  • Storage cost on AWS: (7 GBytes * $0.0125 per GB-month [VCF]) + (322 GBytes * $0.00099 per GB-month [everything else]) = $0.41 per month

Overall, I can reduce my monthly storage costs by over 95% by using lower-cost storage tiers on AWS (see Table 1 below). Again, the comparison is apples-to-oranges because I did not use DNAnexus’ archiving service, mostly because it required a separate license to activate. Using Amazon S3, our monthly WGS storage costs will decrease from $24 per month to less than $1 per month.

Table 1. Comparison of AWS and DNAnexus storage pricing (accessed August 23, 2020).

Lack of price transparency

If we compare AWS’ S3 storage price from 5 years ago to DNAnexus’, we find that the storage markup was 35% over the S3 list price. It turns out that Amazon decreased its S3 storage price over the past 5 years, which led DNAnexus to drop their storage price to the current $0.03 per GB-month, still at a 35% markup. (For comparison, on demand GPU- or FPGA-based compute cycles (Amazon EC2) are marked-up over 100%.)

I do not fault DNAnexus for marking-up AWS pricing–they are a business and provide value beyond storage and compute cycles. However, you will not find any pricing information on the DNAnexus website. In addition to storage costs, add-ons like archiving and GxP regulatory compliance require separate licenses that are not disclosed when signing-up. Presumably, the company’s professional services team assists with these onboarding activities.

How to move your data from DNAnexus to AWS

So, having made the decision to move my WGS data to AWS, how did I do it?

On the DNAnexus platform, I used AWS S3 Exporter, a company-provided tool to upload data to an AWS S3 bucket (DNAnexus account required). You can invoke the exporter using either their SDK (dx-toolkit) or an online wizard–both methods work great. The DNAnexus policy documentation does not include verification by default, so I updated the AWS IAM policy file with a resource-based policy and also enabled transfers to work with verification:

{
    "Version": "2012-10-17",
    "Statement": [
        {
            "Effect": "Allow",
            "Principal": {
                "AWS": "arn:aws:iam::yourAccountNumber:root"
            },
            "Action": "s3:ListBucket",
            "Resource": "arn:aws:s3:::yourBucketName",
            "Condition": {
                "StringLike": {
                    "aws:Referer": "https://platform.dnanexus.com/*"
                }
            }
        },
        {
            "Effect": "Allow",
            "Principal": {
                "AWS": "arn:aws:iam::yourAccountNumber:root"
            },
            "Action": [
                "s3:PutObject",
                "s3:GetObject"
            ],
            "Resource": [
                "arn:aws:s3:::yourBucketName",
                "arn:aws:s3:::yourBucketName/*"
            ],
            "Condition": {
                "StringLike": {
                    "aws:Referer": "https://platform.dnanexus.com/*"
                }
            }
        }
    ]
}

Another improvement: You can transfer your data from one S3 instance to another (DNAnexus to AWS) at the rate of 250 GBytes per hour, including verification. Five years ago, the transfer speed was 10 GBytes per hour!

One final gotcha

One thing that has not changed in 5 years is the “data transfer out” fee. Amazon’s fee is $0.09 per GByte and DNAnexus’ fee is $0.13 per GByte. This fee is an understandable disincentive to keep you from moving your data around too much. In my case, moving our family’s WGS data to AWS will add over $100 to the final bill. It’s a little like losing all your money at baccarat and then finding out that you still owe the banque a commission before you leave the table. Not a big deal when you are a family, but when you are the UK Biobank expecting to grow to 15 petabytes over the next 5 years…well, you get the idea.

For the money, take a look at upstart competitors like Basepair or ixLayer.

[Update 2021-01-10: Do not forget to remove the DNAnexus API, called dx-toolkit!]

sudo apt-get remove --purge dx
sudo apt autoremove
sudo rm /etc/apt/sources.list.d/dnanexus.list

My WGS data is now available on Amazon S3

Read the blog post

Is genetics like finding a needle in a haystack?

wheatstacks
Claude Monet, Wheatstacks (End of Summer), 1890-91. The Art Institute of Chicago.

You may know this painting, one of over two dozen haystack paintings (actually, stacks of wheat) that Claude Monet produced at various times and seasons. What if we hid a needle one of them? Could we find it? In genetics, we often say that finding a genetic variant is like finding a needle in a haystack. But how big is the needle? How big is the haystack? Who believes this stuff?

Francis Collins, NIH director and leader of the Human Genome Project, is a clear believer. In a recent PBS series by Ken Burns, The Gene: An Intimate History, Dr Collins said that finding a misspelling in a gene that causes a particular disease is “a needle in a haystack.

collins-quote
Dr Francis Collins, NIH director

So, in honor of April 25th, National DNA Day, which commemorates the discovery of DNA’s double helix in 1953 and the publication of the first draft of the human genome in 2003, I embarked on a curious journey to answer these questions. My approach would be to determine the volume of a needle and then figure out how large to make the haystack to see if the analogy holds.

What is the volume of a needle?

How do you calculate the volume of a needle? It is useful to start with some real needles, and it turned out that I had a small box of 30 assorted needles–here’s a photo of them:

needles
30 needles ranging is size from 30 mm to 60 mm

Needles come in all kinds of lengths, but I was looking for an “average” needle, so I made a rough list of their lengths and came up with this:

Average needle length: sum(5 x 30 mm, 10 x 35 mm, 11 x 40 mm, 1 x 45 mm, 1 x 50 mm, 1 x 55 mm, 1 x 60 mm) / 30 = 37 mm or 1.4 inches

needle1
A very average needle from my sample (length = 37mm, diameter = 0.75 mm)

Volume of a needle: displacement method

Next, I had to figure out the volume (V) of a needle. My first approach was to drop the needles into a graduated cylinder filled with water and then measure the displacement.

Graduated cylinder filled with 40 ml water (left). Needles in graduated cylinder (middle). Close-up photo showing 0.5 ml water displacement (right).

It turns out that 30 needles displaced 0.5 ml of water, so we divide by 30 to get the average volume of the needles in my sample.

V = 0.5 mm / 30 = 0.016 ml or about 0.02 ml per needle

Can we find a different method to measure the volume of the needle and compare results?

Volume of a needle: small cylinder

Another way to approximate the volume of the needle is to view it as a small cylinder using the formula: V = pi * r^2 * height. Since we are looking for volume (V), we want to express our measurements in centimeters to end up with cubic centimeters (cc).

V = pi * (0.075 cm / 2)^2 * 3.7 cm = 0.016 cc, or about 0.02 cc

Since 1 ml = 1 cc, we can say that the volume of our needle is 0.02 ml, which is spot on with our previous measurement. Note: It is rare in science that your numbers match exactly, but we’ll take the win and start building our haystack.

Building a genetic haystack

Our next task is to build a haystack that approximates the size of the human genome, where each A-T or C-G base pair in the human genome is the size of a needle. The Human Genome Project pegs that number around 3 billion base pairs within one copy of a single genome.

We build our genetic haystack by defining it as a volume having 3 billion opportunities to find a 0.02 ml object, or volume (V) equals 3,000,000,000 * 0.02 ml.

V = (3*10^9 * 0.02 ml) = 60*10^6 ml or 60,000,000 ml

Since 1 ml = 1 cubic centimeter (cc), the volume can also be stated as 60,000,000 cubic centimeters or 60*10^6 cc. Finally, 1 liter = 1000 ml, so the volume in liters equals 60,000,000 ml * (1 liter / 1000 ml).

V (haystack) = (60*10^6 ml) * (1 liter / 1000 ml) = 60*10^3 liters or 60,000 liters

We now know how much space it occupies, but what does it look like? For example, how tall is our haystack?

Shape of a genetic haystack: approximation with a hemisphere

Like the needle, we can approximate the shape of a haystack to something easy to calculate, like the volume of hemisphere in cubic centimeters: V = 2/3 * pi * r^3.

V (hemisphere) = 60*10^6 cc = 2/3 * pi * r^3

Solving for the radius (r), we get r = 306 cm. Since 1 m = 100 cm, the height (radius) of the hemisphere equals 306 cm * (1 m / 100 cm).

r (hemisphere) = 306 cm * (1 m / 100 cm) = about 3 meters or 10 feet tall

So, we have a rough idea of what an idealized haystack looks like. It is 3 meters tall and it is shaped like a hemisphere. But how accurate is our measurement? Can we do better? Has anyone studied haystack modeling? Indeed, someone has and his name is W.H. Hosterman.

Shape of a genetic haystack: using haystack modeling

hosterman-stacks
Outline drawings of square hay stacks of different shapes

In 1931, W.H. Hosterman from the U.S. Department of Agriculture published an extensive technical bulletin “for the purpose of determining the volume and tonnage of hay.” Hosterman and his USDA colleagues measured over 2,600 haystacks across 10 states and presented results for both square and round haystacks. For round haystacks, Hosterman derived this formula: V = ((0.04 * Over) – (0.012 * C)) * C^2, where C is the circumference of the haystack, and Over is the measurement of the circumference of the stack over the top. We can compare results with the hemisphere by selecting equivalent values from Table 7 in Hosterman’s paper.  (We will momentarily switch to imperial units to make use of the constants in the formula.)

V (Hosterman) = ((0.04 * 32 ft) – (0.012 * 62 ft)) * 62^2 = 2,060 cubic feet or 58,333 liters 

The observed height of Hosterman’s haystacks are slightly taller than wide, but their sloped tops make the volume of the “true” haystack (58,333 liters) a little less than our original estimate of a 3-meter-tall, 60,000-liter haystack. When we compare the volume using Hosterman’s formula to the volume of the hemisphere, we see that they differ by 1,667 liters, or about 3%. Close enough!

Genetics is like finding a needle in a haystack

We have two comparisons that match closely. So, what does that haystack look like?

romanian-haystack
Romanian haystacks are typically 3 to 4 meters tall.

It turns out that Romanian haystacks are about 3 meters tall, so finding a misspelling in a gene (a genetic variant) is indeed like finding a needle in a haystack.

Who looks for needles in haystacks?

If genetics truly is like finding a needle in a haystack, what kinds of people do this? Well, let’s go back to Francis Collins.

In 1993, Collins published a paper describing the genetics of cystic fibrosis, a disease that required finding “a needle in a haystack.” Today, we have found needles from thousands of genetic haystacks. Some of these needles lead to clues about rare diseases, which affect more than 400 million people worldwide.

In real life, you can find a needle in a haystack, too. In 2004, performance artist Sven Sachsalber found a needle in a haystack after hunting for it for 24 hours. If we could get computers to solve diseases at that speed, we would happily be out of work.

sachsalber-aiguille
In 2004, performance artist Sven Sachsalber found a needle in a haystack at the Palais de Tokyo in Paris.

OK, back to finding more needles…

#JoinAllofUs

Today I joined All of Us, a research community of one million people to lead the way for individualized prevention, treatment, and care for, well, all of us. This project was previously known as the Precision Medicine Initiative.

Many of you know that our family has used whole genome sequencing to look for clues in our daughter’s autism. This blog shares that journey. I have also published peer-reviewed papers to explore the reasons why people share personal health information. Through this research, I am convinced that information sharing will contribute to a learning healthcare system to improve care and lower costs.

It just takes people like you and me to #JoinAllofUs and lead by example.

AllofUsBanner


Big data: From medical imaging to genomics

Pickard-KT-and-Kimberly
KT & Kimberly Pickard

In 2006, a Scientific American article written by George Church, “Genomics for All,” rekindled my interest in genomics. I went back to school in 2009 to contemplate the business of genomic medicine, and celebrated my MBA by writing a Wikipedia entry for the word, “Exome.” I was hooked.

We started our odyssey by genotyping our family using 23andMe, and later my wife and I had our whole genomes sequenced. Realizing that genomics were starting to yield clinically useful information, we crowdsourced the sequencing of our kid’s genomes to look for genetic clues in their autism. We found interesting results, gave talks and wrote papers.

imaging-to-genomics-2014-03-06

Along the way, I realized that medical imaging and genomics are highly complementary: genomics informs or identifies conditions, and radiology localizes them. Sarah-Jane Dawson pointed this out at a Future of Genomic Medicine conference in 2014.

DIY genomics, autism, and coffee on Mendelspod

I have been a long-time listener to the intelligent and informative podcasts on Mendelspod, a site that connects people and ideas in life sciences. (Most nights you can find me listening to Mendelspod while I do the dishes.) I tuned-in sometime in 2012 and created a mental map of the industry by listening to every podcast I could find. A steady diet of listening to the latest developments in the industry has allowed me to talk about genomics with ease at meetups, tweetups and conferences. (OK, going back to school helped, too.) Somewhere along the way I decided that I would do something worthy of being interviewed on the show.

Well, last week I got my wish when my interview was posted on Mendelspod. I talked about our crowdfunded family trio sequencing project, autism, and even “coming out” of the research closet after being invited to speak at a conference in China last year. We explored parallels between my career in medical imaging and the future of genomic medicine (more in this blog post).

We concluded the interview by talking about Genomics Coffee, a (now defunct) discussion group that met in San Francisco.

Many thanks to Theral Timpson and Ayanna Monteverdi, co-producers of Mendelspod, for their great show.

DIY Genomics at MindEx 2015

image
I recently presented results from our DIY genomics project at MindEx 2015 held at Harvard’s very Hogwarts-looking Sanders Theatre.

Hosted by the Mind First Foundation, this conference enabled participants in the Personal Genome Project to hear first-hand how their health data could be used in research, especially mental health research. The second day of the conference, the “PGPalooza,” let PGP participants directly interact with researchers to select projects of interest and have their questions answered immediately.

James Tao graciously edited this 25-minute video of my talk about family trio sequencing and autism:

Also, special thanks to Alex Hoekstra, co-founder of Mind First, for the invitation to this event.

Additional resources: Video Slides

Why I uploaded my WGS data to DNAnexus

In this blog post, I look at whole genome sequence platforms for storage and discuss what might happen to “genomical” amounts of data.

Background

When I uploaded my whole genome sequence in September 2014 (about 10 months ago), few options existed for sharing personal genomic data. The usual suspects (DropboxEvernote and Figshare) were prohibitively expensive for large amounts of data. I knew about DNAnexus, but I saw it as a platform for researchers, not consumers. Well, times have changed. Fast.

A Battle of Platforms?

In addition to my original “roll your own” approach, DNAnexus and Google Genomics have emerged as major players for end-to-end genomics workflow. In the table below, you can see that storage costs for AWS S3, DNAnexus and Google Genomics are roughly the same. Everyone provides free uploads (we want your data!), but the cost for transferring data out of the system varies. Google Genomics does not charge for this, but instead charges for API access. For my current AWS storage, I pay about $4 per month to store my genome.

WGS-Storage-Pricing
Table 1. Comparison of AWS, DNAnexus and Google Genomics storage costs. Your mileage may vary. Accessed July 7, 2015.

Ultimately, I selected DNAnexus over Google Genomics because their workflow API is well-developed and appealed to my roll-up-your-sleeves sensibility. (If you’re comfortable with command-line work, this platform is for you. BaseSpaceGenoSpace and Galaxy are other platforms to consider.) Google Ventures backed DNAnexus in 2011, so it’s difficult to predict what will happen in the long run. What we do know is that the value of their respective platforms will increase as more people join (and add data) to them. Google Genomics has partnerships with DNAstack, Autism Speaks and even DNAnexus. DNAnexus has partnerships with Baylor College of Medicine, WuXi NextCODE, and the Encode Project. The battle begins. If these two platforms can maintain standards-based interoperability, the competition is good for everyone.

Astronomical becomes Genomical: A Perspective on Storage

In this recent article about big data and genomics, the authors compare the field of genomics with three other Big Data applications: astronomy, YouTube and Twitter. In common with genomics, these domains: 1) generate large amounts of data, and 2) share similar data life cycles. The authors examine four areas–acquisition, storage, distribution, analysis–and conclude that genomics is “on par with or the most demanding” of these disciplines/applications. My previous experience in medical imaging (a field that arguably tackled the prior generation of “big data” issues) leads me to believe that genomics will come to epitomize Big Data to many more people before long.

growth-of-DNA-sequencing
Growth of DNA sequencing. Source: http://journals.plos.org/plosbiology/article?id=10.1371/journal.pbio.1002195

If you look carefully at the projections in the figure above, we may run out of genomes to sequence (really?), which brings us back to storage. Where will we store all of this sequence data, especially as genomic medicine continues its inexorable move to the clinic?

running-out-of-genomes-twitter

Delete Nothing and Carry on

If the field of medical imaging is an indicator, deleting anything after it has been archived is the exception rather than the rule. The main reason for this is medicolegal — hospitals avoid the liability of not being able to recall an exam later by keeping everything. Although the incidence of requiring access to images after diagnosis is low, the consequence of not having access to the original diagnostic image is high. A former colleague suggested that about 5% of their medical archive customers use lifecycle management features to delete imaging exams. In medical imaging, customers more commonly use lifecycle management features to migrate images to less expensive storage devices over time. So, in genomics, you might migrate your sequence data stored on Amazon from solid state storage (most expensive) to S3 to Glacier (least expensive). But my best guess: we’ll delete nothing and carry on.

Storage is one aspect of genome informatics that is undergoing rapid change. You can learn more at upcoming events like the HL7 2015 Genomics Policy Conference and CSHL’s 2015 Genome Infomatics Conference in October.

Stay tuned!

Update: Why I moved our WGS data from DNAnexus to Amazon S3

Read the updated blog post

Finding Genetic Clues in Autism with Family Trio Sequencing

Yesterday, I presented preliminary findings at the 2015 Clinical Genome Conference in San Francisco from our family trio sequencing project. In this crowdsourced project on experiment.com, I looked for genetic clues to autism in our adult-aged daughter. While the talk focused on the “DIY” aspects of how to accomplish WGS sequencing, this post focuses on genetic findings.

Overview

The project began with a crowdsourced effort to raise $1,750 to sequence our daughter’s genome, and took slightly more than two months to complete. After working with AllSeq and HudsonAlpha to obtain WGS data, we used VarSeq from Golden Helix to search for unique variants, as well as browse whole genome sequence data. After filtering our variant call data to focus on high quality exome variants, we examined 52 potentially damaging de novo and compound heterozygous changes suggested by VarSeq’s family trio analysis. Although this first approach did not yield clues specific to autism, it did suggest a number of secondary findings that are not addressed here. The second approach was to start with genes having known associations with autism and then look for them in our daughter’s DNA. Several curated databases have between 200 and 1200 genes, but again, none produced meaningful results. The third method was to look at known “hot spots” in autism genetics, such as variants in the NRXN1 gene, as well as known structural variation on chromosome 16. Changes to NRXN1 and so-called “16p” changes are discussed below.

Findings 

  • NRXN1-Deletion-AnnotatedNRXN1 – Deletions in NRXN1 are associated with a wide spectrum of developmental disorders, including autism. Our daughter has a 10bp exonic deletion (-GT repeat) followed by what appears to be a 9bp compound heterozygous deletion in NRXN1. Both deletions are partially present in both parents and overlap; the deletions appear to have been accumulatively inherited. Due to the high number of sequence repeats, copy number variation (CNV) should clarify the significance of this finding.
  • 16p11.2-Deletion-Annotated16p deletions – Deletions and duplications in this 593-kilobase section of chromosome 16 are widely associated with developmental issues, including autism. Our daughter appears to have dozens of deletions in this region, some inherited and some not. However, since the variants in our daughter’s DNA were called using a different software pipeline, it is difficult to draw meaningful conclusions (see “Limitations,” below). For example, some variants in our daughter’s DNA were shown to map to multiple locations on the genome, suggesting either large copy number variation or genomic regions that were difficult to map. Copy number variation (CNV) analysis will also elucidate this region. Once reprocessed, these findings may provide potential genetic clues to our daughter’s condition.

Limitations

My wife and I received our WGS data in March 2014. Our samples were sequenced at 30x coverage using Illumina’s HiSeq platform and then aligned and called with Illumina’s pipeline, Isaac. Our daughter’s DNA was sequenced in May 2015 at 30x coverage, but on Illumina’s newest platform, the Illumina HiSeq X Ten. The difference is that our daughter’s DNA was aligned using BWA, followed by variant calling with GATK “best practice” workflow. To accurately compare genomes in family trio analysis, all samples must be processed using the same software pipeline. Otherwise, variants may be aligned and called differently. My wife and I must go back to the (almost) original FASTQ data and start over. Although Illumina did not provide these files with our results, Mike Lin explains how to extract FASTQ files from Illumina data in this great blog series. Hint: it involves a utility called Picard (no relation). Until we reprocess our WGS data using the same bioinformatics pipeline, all results should be considered preliminary.

Conclusion

This project demonstrated that personal genomics is very real, and has the potential to answer complex medical questions. Today, answering those questions using whole genome data and family trio analysis requires a combination of genetic, bioinformatic and domain knowledge to reach meaningful conclusions. Validating those conclusions remains challenging, from rare diseases to complex conditions such as autism. Currently, personal genomics has a similar feel to “homebrew” computer clubs from the late ’70s–the community is still very small, collegial, and willing to share “tips and tricks” to advance the field.

Although we encountered some “dark alleys” during the analysis, our preliminary results suggest that family trio sequencing can indeed provide genetic clues to autism. We will continue to refine the analysis by reprocessing the data with the same pipeline, which should resolve questions in the 16p region, as well as the potential deletion in NRXN1. Further, CNV analysis should answer structural variation questions that are also known to be associated with autism spectrum conditions

Acknowledgements

I would like to thank our backers and the team at experiment.com, as well as Gabe Rudy from Golden Helix. Gabe was very generous with his time, knowledge and insight. Finally, I would like to thank my wife, Kimberly, for her patience and fortitude. 

Additional resources: Slides